October 2023 El Niño update: big cats
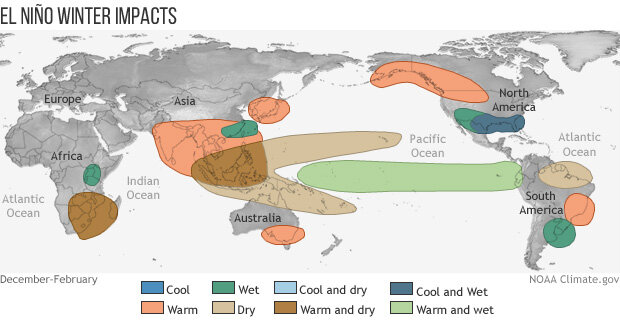
El Niño is currently purring along in the tropical Pacific. Forecasters expect El Niño will continue through the spring, with a 75-85% chance it will become a strong event. A stronger El Niño—definition to follow shortly—means it is more likely that we will see El Niño’s expected thumbprint on winter temperature and rain/snow patterns around the world.
The tiger’s stripes
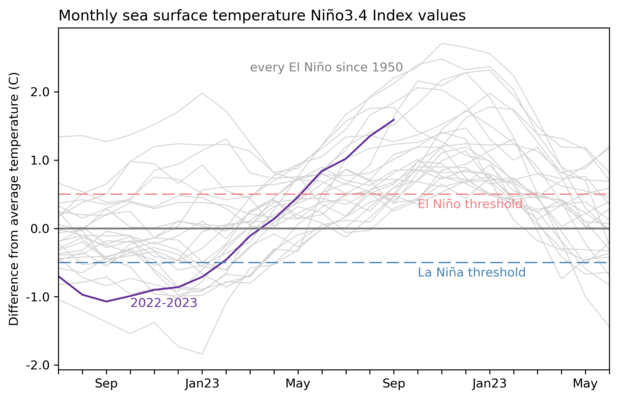
First, the numbers. Our primary metric for the growth of El Niño is the temperature of the ocean surface in the Niño-3.4 region, a box in the central-eastern equatorial Pacific. Specifically, the anomaly, the difference of this temperature from the long-term average (long-term = 1991–2020). (Why here? Several decades ago, this region was found to have the strongest relationship with tropical atmospheric changes.) In September, the Niño-3.4 Index was 1.6 °C (2.9 °F), according to the ERSSTv5, our most reliable sea surface temperature dataset.
El Niño is a coupled system, meaning the ocean and the tropical atmosphere are working together to continue and grow the El Niño event. The average air circulation pattern over the tropical Pacific, called the Walker circulation, brings rising air, clouds, and storms over the very warm water of the far western Pacific, west-to-east winds high up in the atmosphere, descending air over the eastern Pacific, and the east-to-west surface winds called the trade winds. In the case of El Niño, the warmer-than-average surface water in the central-eastern Pacific leads to more rising air over that region, weakening the Walker circulation.
The atmospheric half of El Niño is clearly showing its stripes. All the signs of a weakened Walker circulation are present, including more rain and clouds over the central-eastern Pacific, slower trade winds and upper-level winds, and drier conditions in Indonesia and the far western Pacific. Taken collectively, the ocean surface and the atmospheric conditions tell us that El Niño will stick around for the next few months at least.
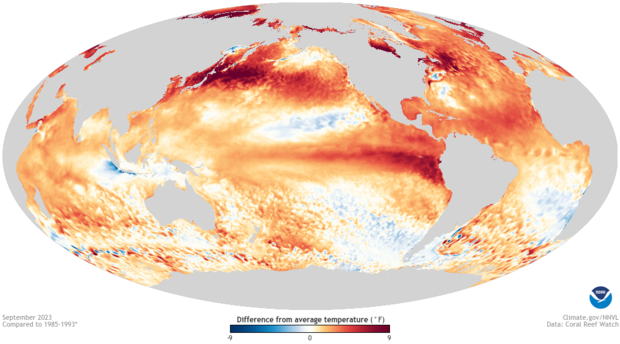
September 2023 sea surface temperature difference from the 1985-1993 average (details from Coral Reef Watch). Much of the global oceans are warmer than average. NOAA Climate.gov image from Data Snapshots.
The lion’s roar
Since we’re sure El Niño will be operating into the winter, the next question is “how strong will it get?” Strength definitions, which usually also use the Niño-3.4 Index, are unofficial, since it’s not like an El Niño with a peak Niño-3.4 Index of 1.5 °C is going to have noticeably different impacts than one with a peak Niño-3.4 Index of 1.4 °C. However, as I mentioned above, the stronger the El Niño, the more likely it will affect global temperature and rain/snow patterns in expected ways. This is because a larger sea surface temperature change leads to a larger shift in the Walker circulation, making it more likely that El Niño will affect the jet stream and cause a cascade of global impacts.
The unofficial definition of a strong El Niño is a peak 3-month-average Niño-3.4 Index of at least 1.5 °C. El Niño is a seasonal phenomenon, and that 3-month-average Niño-3.4 Index (called the Oceanic Niño Index or ONI) is important for making sure that the oceanic and atmospheric changes persist long enough to affect global weather and climate. A peak ONI of 2.0 °C or more is considered “historically strong,” or “very strong.” We’ve only seen four of these in our historical record, dating back to 1950.
Forecasters give this event a high chance of qualifying as a strong event, based on our climate model predictions and the current conditions. “Hey wait,” you’re saying. “Isn’t the September Niño-3.4 Index already 1.6 °C?” And indeed it is, but the 3-month-average for July–September was 1.3 °C. That said, we have a 75% chance that the ONI will reach or exceed 1.5 °C in November–January (typically the peak season). We actually have a slightly higher chance, 83%, that we will reach that threshold in September-November, which is on our doorstep.
So how about peaking at or above 2.0 °C? Forecasters give that around a 3-in-10 chance for November–January. The climate models have a fairly wide range of potential outcomes—if they were concentrated above 2.0 °C, we’d probably be able to give more confident chances. Also, while there is still a good amount of heat under the surface of the Pacific—this warmer water provides a source to the surface—it’s not quite at the level we’ve seen during previous historically strong El Niños like 1982–83, 1997–98, or 2015–16.
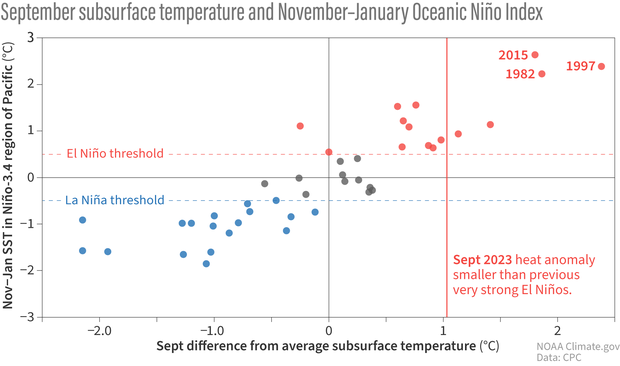
Each dot on this scatterplot shows the subsurface temperature anomaly (difference from the long-term average) in the central tropical Pacific each September (horizontal axis) since 1979 versus the oceanic ENSO conditions the following November–January (vertical axis). The vertical red line show the September 2023 subsurface temperature anomaly. The amount of warmer-than-average water under the surface in September has a strong relationship with the oceanic ENSO conditions later in the year. Previous very strong El Niño events, 1982–83,1997–98, and 2015–16, had more subsurface warm water than 2023. Data from CPC, image by Climate.gov.
This is a small sample of very strong events, though, and the current moderate subsurface temperature certainly doesn’t preclude this event peaking above 2.0 °C. It just contributes to a tempering of the odds.
The leopard’s spots
One more thing I wanted to cover this month—the temperature of the global oceans is still running way above average, with startling records in recent months.
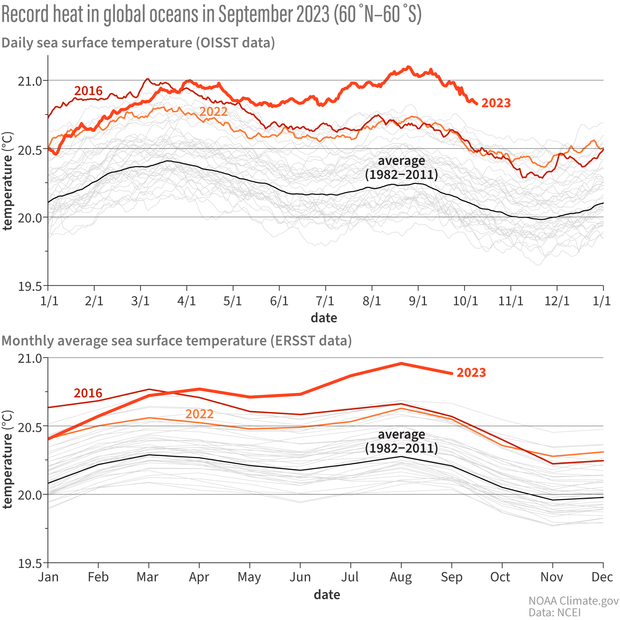
Non-polar (60 °N – 60 °S) global averaged sea surface temperature from 1982-2023 from (top) daily OISSTv2.1 and (bottom) monthly ERSSTv5 datasets. The thick black lines represent the 1982-2011 average across the calendar year; 2022 (orange line), 2023 (thick red line), and 2016 (the year of record warmth before 2023; thin red line) are highlighted. The thin grey lines represent all other years. Both graphs indicate that the last few months have experienced record global ocean warmth. NOAA Climate.gov image based on graphs by Boyin Huang and data from NCEI.
We last featured these graphs, kindly provided by Dr. Boyin Huang of the National Centers for Environmental Information, in May. They show two different datasets, one with daily values and one with monthly averages. Whenever we see something really extraordinary, like the recent records, we want to be sure it’s not a data error. Checking two different datasets provides confirmation that this is a real feature.
The extreme warmth in the global oceans—also noticeable in the map I showed above—means this El Niño is operating in a different world than earlier El Niño events. For example, the Atlantic hurricane season is often on the quieter side overall during El Niño, but this year has already seen an active season, with 18 named storms, as the very warm North Atlantic Ocean has provided lots of fuel.
Cat nap
We’re never going to sleep on the ENSO job! Check back later this month for a post on El Niño and snowfall patterns, and I’ll be back in November to update you on all things El Niño.
Comments
El Nino and dramatic rainfall in Northeast
Looking back on the accumulated data can we tie El Nino to the tremendous rains received in New Engalnd that is having a dramatic effect on our Fall Colors
More likely than not, that…
More likely than not, that was simply a result of our random atmosphere as opposed to El Nino as the culprit.
COP28
Congratulations on getting selected to be part of NOAA's contingent at COP28 this year!
On Tom's behalf: Thanks!!
On Tom's behalf: Thanks!!
Subsurface temperature
Hello, I am aware of SST but on this post you have subsurface temperature. Is this some kind of feline synonym or there is a fox in the story?
Thank you,
Pierre
Scientists break down the…
Scientists break down the ocean into all sorts of CAT-egories when looking at El Nino.
Subsurface temperatures (temperatures at depth in the ocean) help scientists know how much or little warmer than average water at depth that can help develop an El Nino.
Atmospheric coupling
Hi there,
What is a better way to measure atmospheric coupling in ENSO? Multivariate ENSO Index (MEI) or ENSO Longitude Index (ELI)?
It's a good question! Both…
It's a good question! Both MEI and ELI have their proponents. For the purposes of making our forecasts, we usually consider a number of different components of atmospheric circulation, rather than one combined index like MEI or ELI. These include the EQSOI and SOI, which measure atmospheric pressure, an OLR index that tells us how cloudy various regions of the tropical Pacific are, and the low-level winds.
Thanks Emily!
Thanks Emily!
SIDS
Thanks so much for the continued fantastic work and the data and information you make freely available to us all but please one small favour. Please can you avoid using hemisphere specific terms like winter, summer etc. when discussing global phenomena like ENSO. It’s confusing and ENSO affects even those regions with no distinct annual season, let alone those of us who hang upsidedown by our CAT-like claws in the south.
Thank you - love your work!
Thanks for this comment! I…
Thanks for this comment! I will try to be more specific in the future. ENSO is a global phenomenon, as I am constantly saying!
ENSO
Thank you again Emily Becker for the nuances.
El Nino in New England
So much dissonance when reporting the El Nino winter forecast for northern New England. NOAA, the Farmer's Almanac, weather channels, et al. are all equally useless to plan on. I am looking at the tea leaves as we speak.
Modoki or Central Pacific Event
There is has been more online chatter about a CP event or Modoki event developing over winter. I haven't really seen the SSTs forecasted that way over winter. What do you think?
El Nino flavor
The dynamical guidance I have looked at has not favored a CP/Modoki flavor to this El Nino. Actually, the maximum sea surface temperature anomalies have been located east of the average El Nino max location, which is not unusual for stronger events. We'll see if the guidance changes when the new forecast runs come out in a little over a week, but for now, I do not see an obvious reason why a CP/Modoki flavor should be favored.
El Nino
Thanks Nathaniel!!
Atmospheric / Ocean reaction
In order to have an impact with El Nino a positive PDO has to be present. I don't understand why NOAA doesn't consider this teleconnection in their ENSO forecast ? In the last El Nino 2014- 16 we had quite an impact here in Kentucky. The PDO went strongly positive in 2014 long before a very strong El Nino formed in 2015 -16. Now the PDO is still strongly negative which is giving our area along with the rest of the country La Nina like weather pattern. What gives ? I don't want to learn that the PDO lags behind El Nino latter in the Winter. Not true.
El Nino and the PDO
El Nino and the positive PDO often go hand in hand, and the positive PDO is a sign that the North Pacific atmospheric anomalies are consistent with the expected midlatitude response to El Nino. So, I see that it would make sense that the expected impacts of El Nino downstream of the North Pacific in the U.S. tend to accompany a positive PDO. However, this correlation does not prove that the North Pacific sea surface temperature anomalies independent of El Nino that are tied to the PDO are a major cause of the El Nino impacts. There have been many studies investigating the impact of extratropical sea surface temperature anomalies, like those of the PDO, on the atmospheric circulation, and these studies consistently show that the atmospheric response is much weaker and more uncertain than the response to the tropical sea surface temperature anomalies associated with El Nino.
That doesn't mean that the PDO has no impact or that this year could be a unique case where the extratropical sea surface temperature anomalies have an outsized impact on U.S. climate. But even if that's the case, we have to remember that this is the ENSO Blog, and NOAA forecasters making ENSO forecasts are not focused on the ENSO teleconnections or the potential interference by other climate drivers. If the PDO or any other climate driver is expected to impact seasonal climate anomalies over the U.S., then this would be covered in CPC's seasonal outlooks.
Add new comment