
As sea level has changed, so has the way we measure it. Here’s a look at some of the technologies climate and marine scientists have used to track Earth’s tides and global sea level over the past two centuries.
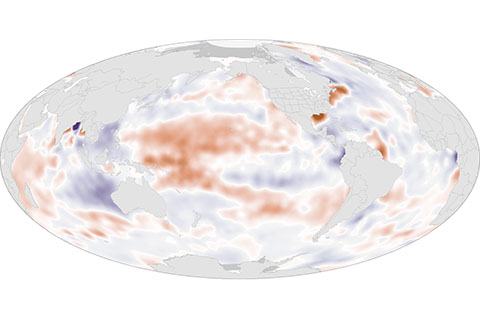
Across the globe, changes in salinity over time generally match changes in precipitation: places where rainfall declines become saltier, while places where rainfall increases become fresher. Where did saltiness change over the past decade?
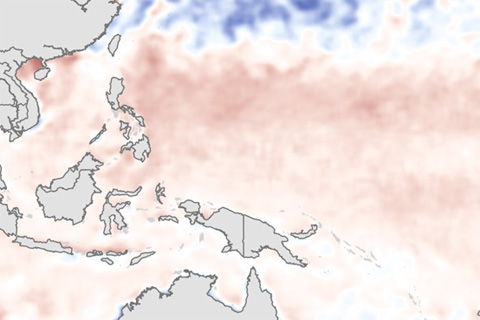
Through June, the eastern Pacific was warmer than average, but the lack of a strong gradient in sea surface temperature anomalies between the eastern and western Pacific may have kept the atmosphere from getting in sync with the developing El Niño.
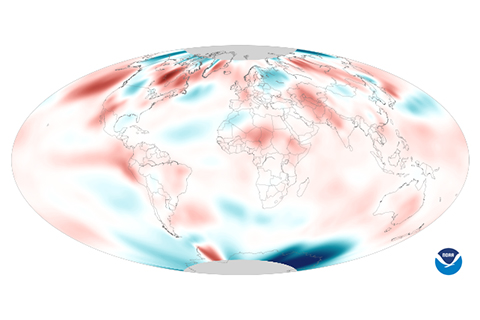
Hot on the heels of a new record set in May, average global temperature also reached a record high in June 2014.

As the assessment now known as the BAMS State of the Climate report pushes into its third decade, international participation is at an all-time high. From atmospheric chemists to tropical meteorologists, more than 420 authors from institutions in 57 countries contributed to this year's report.
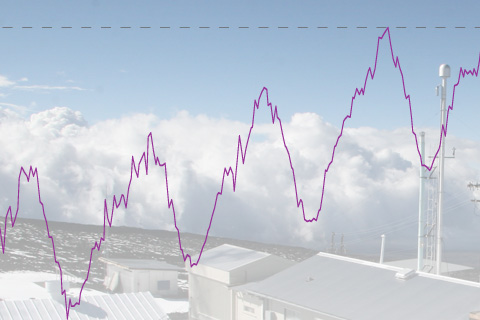
The annual average concentration of carbon dioxide (CO2) in the atmosphere stood at 395.3 parts per million (ppm) in 2013—a 27 percent increase compared to conditions before the Industrial Revolution. On May 9, 2013, the daily average concentration of CO2 surpassed 400 ppm for the first time at the Mauna Loa Observatory in Hawaii.
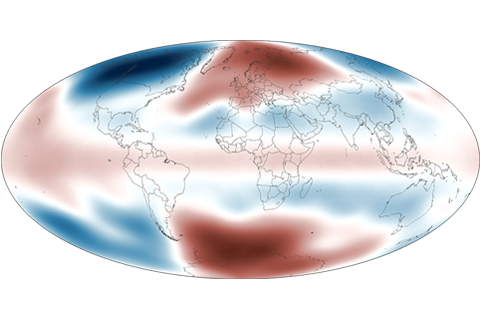
Observing temperature patterns in the lower stratosphere gives scientists clues about our planet's changing climate. Global average temperatures in the lower stratosphere for 2013 were slightly below the 1981–2010 average.
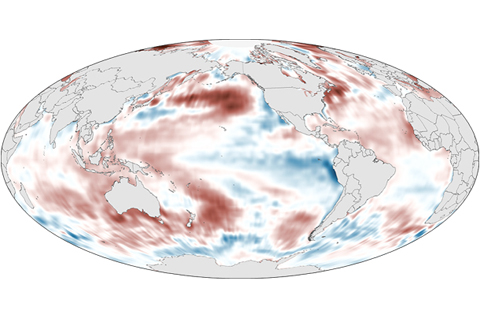
The globally averaged sea surface temperature in 2013 was among the 10 highest on record, with the North Pacific reaching an historic high temperature. ENSO-neutral conditions and a negative Pacific Decadal Oscillation pattern had the largest impacts on global sea surface temperature in 2013.
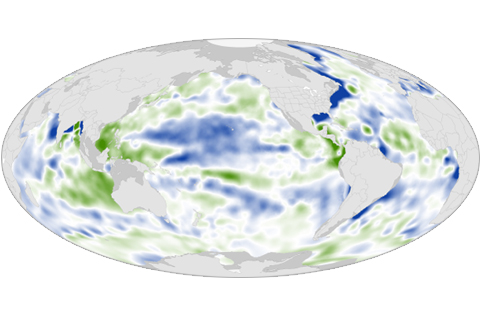
Large-scale patterns of sea surface salinity in 2013 mirrored the overall trend seen from 2004 to 2013: salty, dry areas are becoming increasingly salty, and fresher areas are becoming increasingly fresh.
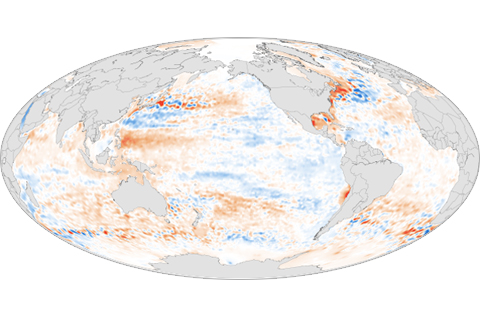
Upper ocean heat content has increased significantly over the past two decades. An estimated 70 percent of the excess heat has accumulated in the top 2,000 feet of the ocean, and the rest has flowed into deeper ocean layers.