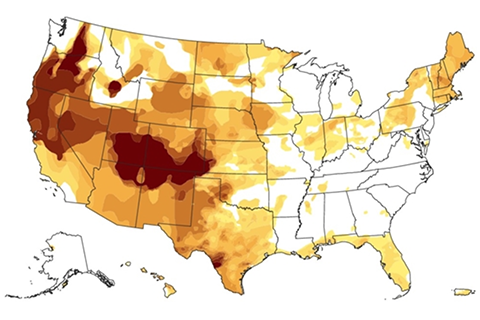
New website features more interactive content and easy-to-understand graphics describing current and predicted drought conditions.
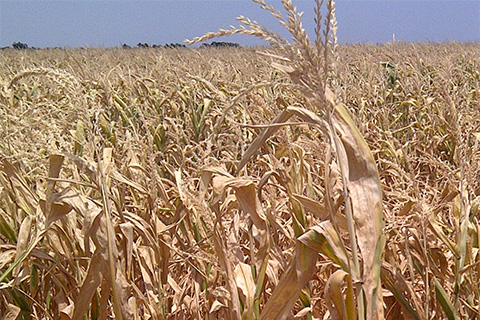
Drought is about more than lack of rainfall. A new tool keeps track of another major player: how thirsty the atmosphere is.
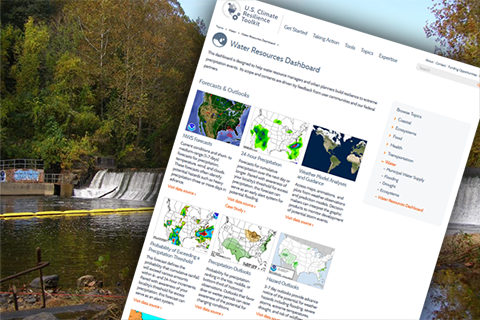
The Climate Resilience Toolkit's Water Resources Dashboard is a one-stop website for data and information on drought, flooding, precipitation, climate, and other water-related risks and opportunities.
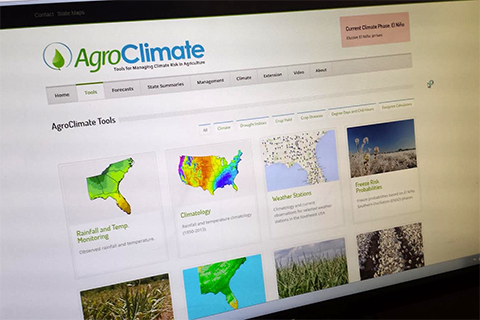
AgroClimate.org is an open-source suite of tools and resources tailored to farmers and ranchers in the southeastern United States.
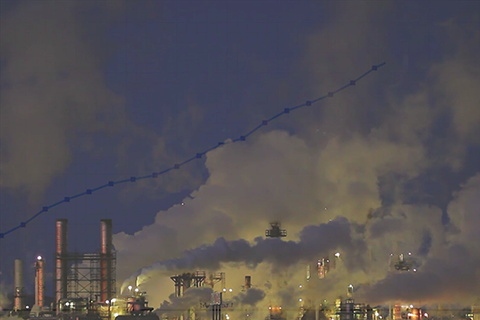
Since 2004, researchers in NOAA’s Global Monitoring Division have released the Annual Greenhouse Gas Index: a single value that compares the total warming effect of each year's concentrations of heat-trapping gases to 1990 levels.
CarbonTracker is a tool for modelling sources and sinks of carbon dioxide. Users can download the code, carbon dioxide data, and the tool's carbon flux estimates to conduct their own analyses or to help improve the system.
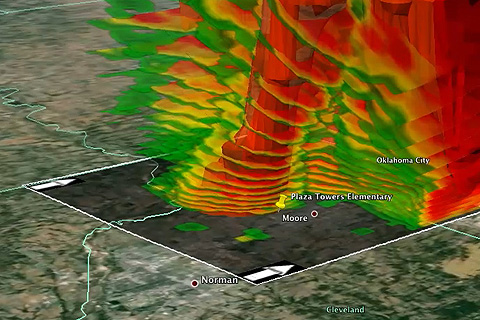
(VIDEO) Visualizing data makes it easier to understand exactly how an extreme weather event affected people’s lives, livelihoods, and property and how those things could be affected in the future. Knowing how to access and analyze the wide variety of datasets needed to study those events can be a challenge, however. NOAA's Weather and Climate Toolkit makes the job easier.
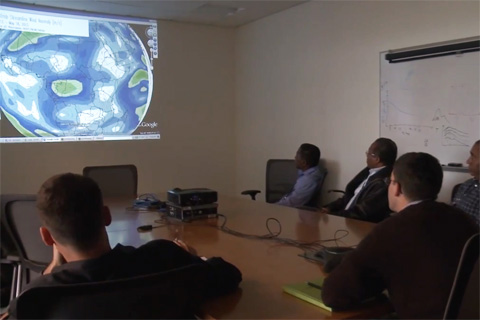
Climate change is a global phenomenon, affecting weather events around the world. Therefore, people around the globe need climate information to anticipate potentially damaging floods, droughts, crop and pest conditions, and disease outbreaks. For 20 years, the scientists at the International Desks of NOAA’s Climate Prediction Center have provided climate outlooks for weeks and months into the future and trained visiting meteorologists to translate climate data into information that can help decision makers in different parts of the world.
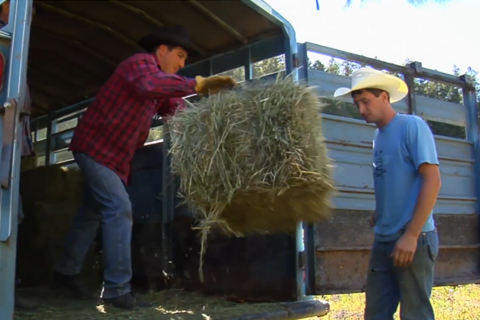
Working with private companies, the U.S. Department of Agriculture’s Risk Management Agency uses precipitation data from NOAA’s Climate Prediction Center as part of an insurance program for ranchers and those who grow hay or other livestock forage. This video describes how it works.
The WestMap climate analysis and mapping toolbox is an interactive, web-based tool that helps users see the climate conditions that underlie droughts, storms, floods, and changes in streamflow.