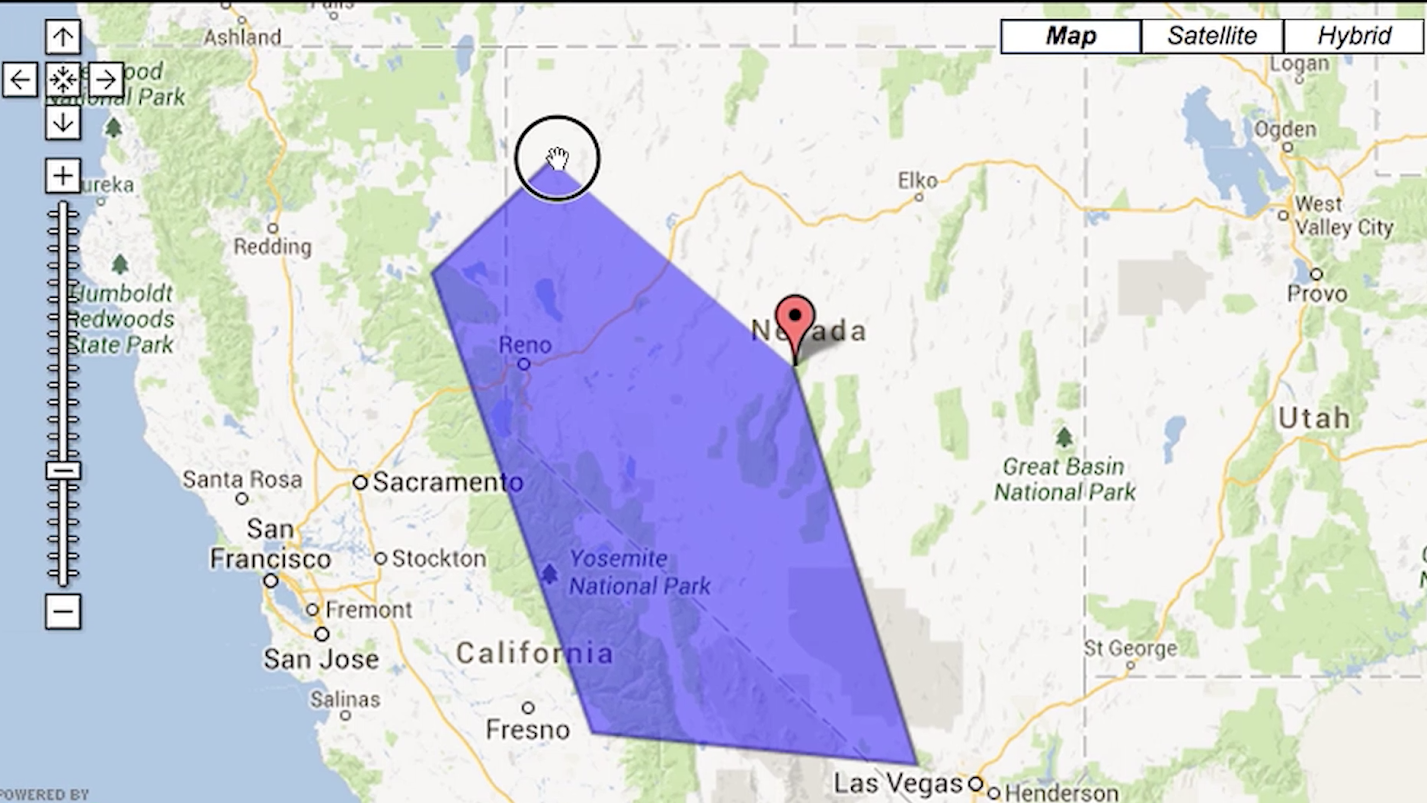
The WestMap climate analysis and mapping toolbox is an interactive, web-based tool that helps users see the climate conditions that underlie droughts, storms, floods, and changes in streamflow.
Videos highlighting tools & data for climate-smart decisions.
The WestMap climate analysis and mapping toolbox is an interactive, web-based tool that helps users see the climate conditions that underlie droughts, storms, floods, and changes in streamflow.
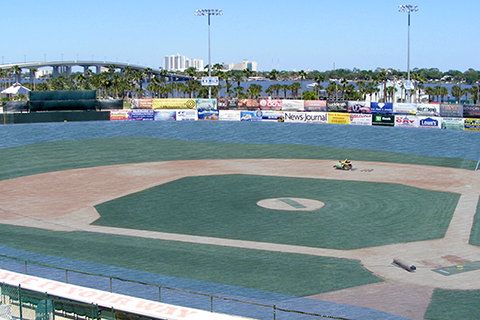
The CanVis tool from NOAA’s Coastal Services Center creates images of potential coastal changes, letting planners and citizens put changes in perspective before they happen.
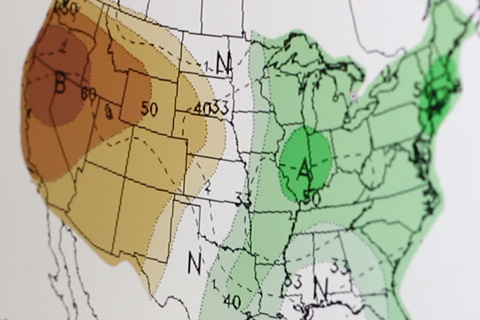
Traditional weather forecasts consist of weather maps that predict exactly how much rain may fall or the maximum daily temperature of an area. NOAA climate outlooks forecast the odds that future weather conditions will be above, below, or near normal.

The U.S. Drought Portal offers access to maps, data, and expert assessments through easy-to-use tools designed to help decision makers monitor, plan for, and recover from water shortages.
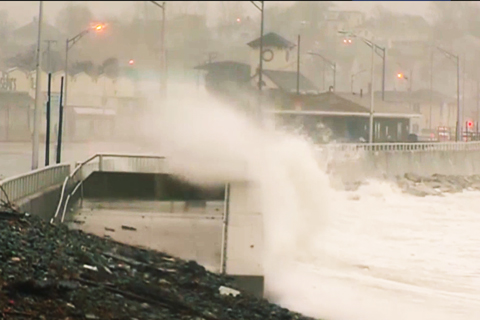
Developed by the NOAA Coastal Services Center, the sea level rise viewer offers access to data and information about the risks of sea level rise, storm surge, and flooding along the coastal United States. The Web-based map has the potential to help people build (or rebuild) in a more resilient way.
Along coasts, people are waking up to the need for adaptation to climate change. This article points the way to information for getting started.