Close on the heels of a record- or near record-hot summer for parts of Southern California and the U.S. Southwest, the first week of September 2024 brought another round of extreme heat to much of the region.
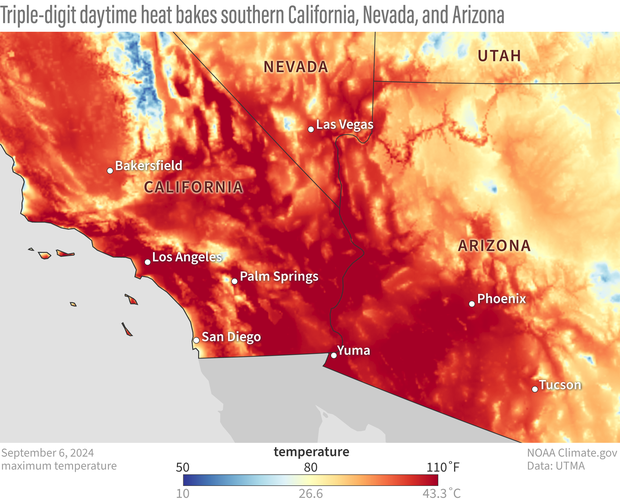
Daytime high temperatures on September 6, 2024, across much of southern California, Nevada, and Arizona, were 100 degrees or more (red). Cooler temperatures (blue, yellow, and orange) mark higher elevations—mountains, buttes, ridges, and the southwest corner of the Colorado Plateau in Arizona. NOAA Climate.gov image using data from NOAA’s Real-Time Mesoscale Analysis (RTMA/UTMA).
Starting near the coast around September 4 and then building inland, the heat raised daytime temperatures 10-20 degrees above normal for this time of year. New daytime temperature records were set in locations from Palm Springs to Yuma to Phoenix, which hit a high temperature of 116 degrees on September 5, tying the record for the hottest daytime temperature for any day in September. A station in Long Beach (south of Los Angeles) hit 109 degrees Fahrenheit on September 6—a new daily record that was 25 degrees hotter than normal for that day of the year.
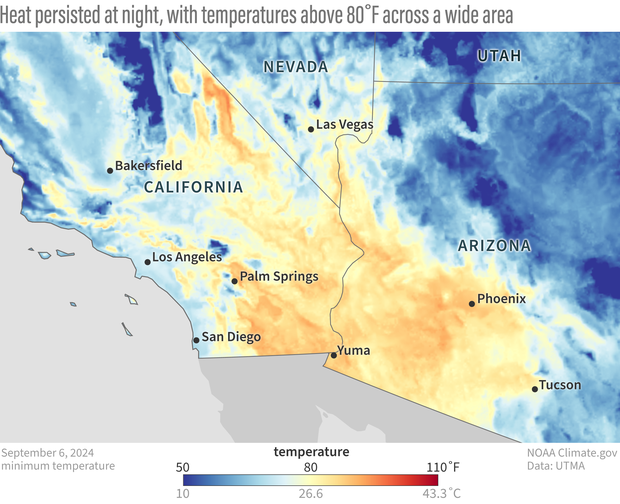
Overnight low temperatures across much of southern California, Nevada, and Arizona, were above 80 degrees (yellow, orange) on September 6, 2024. Nighttime temperatures above 80 degrees increase the risk of heat-related illnesses during heat waves because (in the absence of air conditioning) they don’t give the body a chance to cool off. NOAA Climate.gov image using data from NOAA’s Real-Time Mesoscale Analysis (RTMA/UTMA).
Nights did not cool off as much as they usually do, either. In Palm Springs, Phoenix, and Tucson, the week ending September 8 brought the city its warmest week-long stretch of nighttime temperatures on record for this time of year. [These statistics and others are available from the NOAA Southeast Regional Climate Center’s Climate Perspectives tool.]
Even in a place that’s familiar with extreme heat, the event had serious consequences. Three fires burning in the mountains east of Los Angeles exploded in intensity, billowing smoke and forcing thousands of people to evacuate at short notice, according to news reports. The triple-digit heat also drove a spike in emergency room visits for heat-related illnesses across California, Nevada, and Arizona according to data from the Centers for Disease Control (CDC).
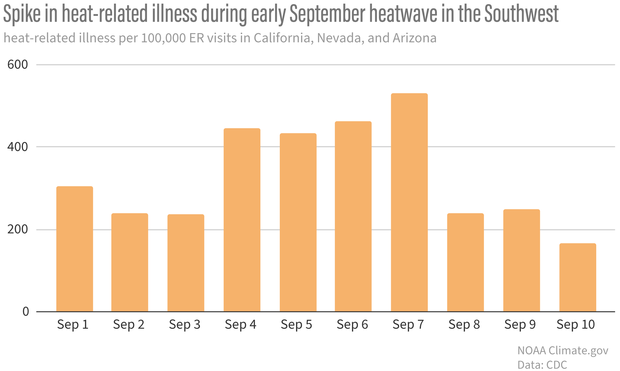
Number of heat-related illnesses per every 100,000 ER visits in California, Nevada, and Arizona from September 1-10, 2024. As triple-digit heat built across the region, the rate of emergency room visits for heat-related illness doubled. NOAA Climate.gov graphic, based on data from the Centers for Disease Control’s Heat and Health Tracker. The tool is one of many available on Heat.gov.
Extreme summer heat on the rise
This heat wave arrived on the heels of an extremely warm summer for the area. Many counties in southern California, Nevada, Utah, and Arizona had their warmest average daytime high temperatures as well as their warmest average overnight low temperatures. Including the recent heatwave, Phoenix set a new record for the longest streak of consecutive days with temperatures at or above 100 degrees, blowing away the previous record of 76 days which was set in 1993.
As a result of global warming, summers are getting hotter across much of the U.S. West, and both the number of heat waves and the length of the heat wave season are increasing, according to the U.S. Global Change Research Program. After compiling records of extreme heat for 50 large cities, the experts concluded:
Heat waves are occurring more often than they used to in major cities across the United States, from an average of two heat waves per year during the 1960s to more than six per year during the 2020s. The average heat wave season across 50 major cities is 49 days longer than it was in the 1960s. Of the 50 metropolitan areas in this [study], 46 experienced a statistically significant increase in heat wave frequency between the 1960s and 2020s. The increase in the length of the heat wave season was significant in 44 locations.
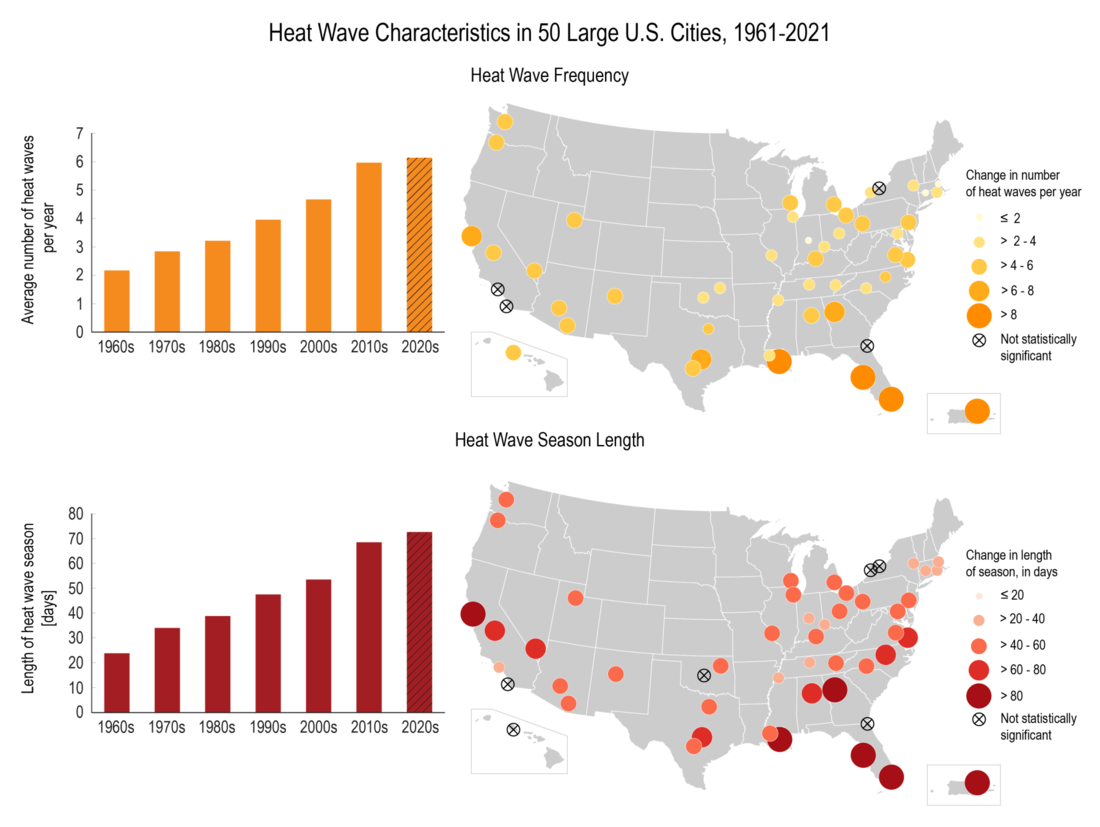
These bar graphs and maps show changes in the number of heat waves per year (frequency) and the number of days between the first and last heat wave of the year (season length). These data were analyzed from 1961 to 2021 for 50 large U.S. metropolitan areas. The graphs show averages across all 50 metropolitan areas by decade. The size/color of each circle in the maps indicates the rate of change per decade for each city. Hatching represents cities where the trend is not statistically significant. Graphic by U.S. Global Change Research Program and Environmental Protection Agency.
Extreme heat is dangerous to people, livestock, and natural ecosystems that are important to us economically and culturally. It can have serious economic impacts. Even with aggressive efforts to limit heat-trapping greenhouse gases like carbon dioxide and methane, heat waves will continue to pose a threat in coming decades.
That’s why NOAA is helping American individuals, communities, and businesses confront this challenge. Working with other federal and state partners, NOAA is providing online tools and resources that allow us to understand the risks we face and take steps to become more resilient. The agency has also been providing funding for on-the-ground heat-mapping in urban areas, so that communities can identify their city’s hottest spots and take action to cool them off or provide needed cooling centers to protect their most vulnerable citizens. To learn more about any of these initiatives, visit the links below.