In southern Africa, the annual rainy season begins around November and is over with by March or April. People depend on the monsoons to bring enough rain to sustain agricultural activities and adequate pasture conditions during the subsequent dry months. If the monsoon starts late, or is too heavy or dry, millions of people can suffer.
So far in the 2014-2015 southern African monsoon in southeastern Africa, rains have been anything but normal. When rains were supposed to begin in November, they didn’t, which lead to growing rainfall deficits, poor ground conditions, and fears of drought reducing crop yields.
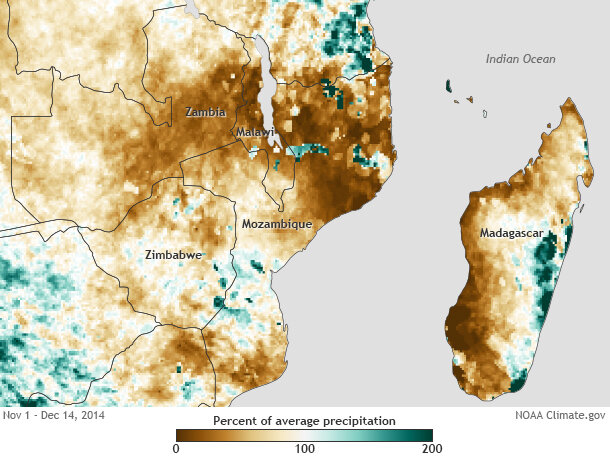
Percent of normal rainfall for southern Africa from November 1–December 14, 2014. Map by NOAA Climate.gov based on CPC’s African Rainfall Climatology (ARC) dataset, which uses satellite and rain-gauge input. ARC’s historical record dates back to 1983.
The epicenter for this laggard start was across Malawi, Mozambique, Zambia, Madagascar, and Zimbabwe. Rainfall estimates for November 1–December 15 from a satellite and rain-gauge based rainfall product called the Africa Rainfall Climatology (ARC), showed amounts less than 25% of average, with totals running 3-6 inches below normal.
When compared to past years, the dryness was among the driest quarter of years since 1983. The impact? Satellite products that measure vegetative health showed ground conditions in the same region taking a quick turn for the worse. Drought concerns were warranted.
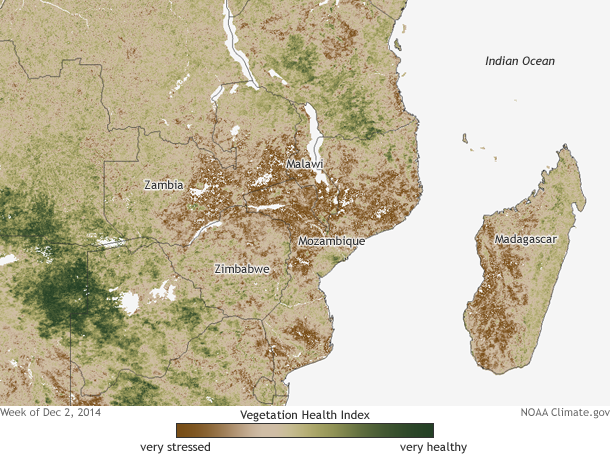
Satellite-based Vegetation Health Index (VHI) for 2014, week 48 (spanning part of the last week of November and the first week of December). Tan areas represent average vegetation conditions. Brown areas have stressed vegetation, while green areas show increasingly healthy vegetation. White patches show lakes and smaller water bodies. Map by Dan Pisut, based on NOAA NESDIS satellite data.
And then? It started to rain… heavily. And it hasn’t stopped, leading to widespread flooding. How bad was the flooding and how above-average were the rains?
Check back later this week for the second chapter of the story of the 2014-2015 southern African monsoon. The first chapter was dry. The second chapter looks to be the exact opposite.