2012—Third Warmest La Niña Year on Record*
Details
*Our original post, based on the Jan. 15 release of the 2012 Global Climate Analysis by the National Climatic Data Center, stated 2012 was the warmest La Niña year on record. Later analysis showed that 2012 was shy of the record by 0.02°C. For more information on the reason for the change, see our related article In Watching for El Niño and La Niña, NOAA Adapts to Global Warming.
After running the numbers for 2012, NOAA reported that the global average temperature in 2012 was 1.03° Fahrenheit above average, ranking it as the 10th warmest year since record keeping began in 1880. Although 2012 warmth did not top the charts, it was the third warmest “La Niña year” on record.
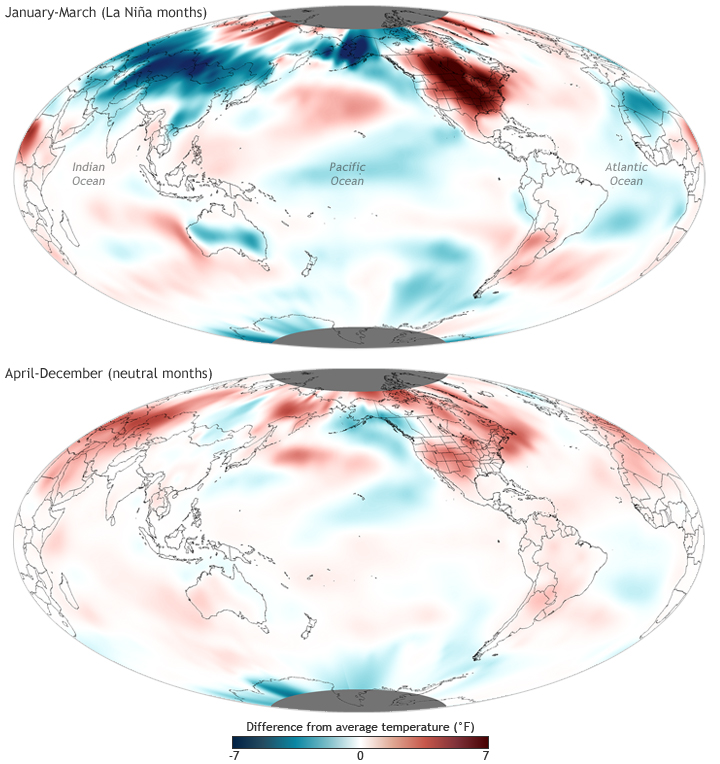
The maps above show temperatures relative to average across the globe for different periods January through March (top) and April through December (bottom). (The full year of 2012 is available via the link below the image). Shades of red indicate temperatures up to 7° Fahrenheit warmer than the 1981–2010 average, and shades of blue indicate temperatures up to 7° Fahrenheit cooler than the average.
La Niña is the cold phase of the El Niño-Southern Oscillation (ENSO), a natural seesawing in ocean temperature and the air pressure of the overlying atmosphere across the equatorial Pacific Ocean. ENSO fluctuates between warmer-than-average ocean surface waters (El Niño) and cooler-than-average ocean surface waters (La Niña) for months to even a year or two at time. The phase of ENSO has a powerful influence on the overall global temperature, and historically, it’s unusual for a La Niña year to be so warm.
Weak-to-moderate La Niña conditions were present in the eastern and central equatorial Pacific Ocean for the first three months of 2012, classifying 2012 as a “La Niña year.” ENSO-neutral conditions prevailed for the remainder of the year in the Pacific, and temperatures were above average across much of the rest of the globe. The warmth of the second part of the year offset the influence of the early-year La Niña, raising the global temperature up into the top-ten warmest.
Additionally, the average global land temperature was 1.62° Fahrenheit above the 20th-century average and ranked as the seventh warmest year on record. Because land surfaces generally have low heat capacity, temperature anomalies can vary greatly over land between months. Over the course of 2012, the average monthly land temperature anomaly ranged from +0.40° Fahrenheit in December +2.50° Fahrenheit in April.
The ocean, however, has a much higher heat capacity than land so its anomalies tend to vary less over monthly timescales. During the year, the global monthly ocean temperature anomaly ranged from 0.54° Fahrenheit in January to 0.99° Fahrenheit in September.
Maps by Dan Pisut, NOAA Environmental Research Lab, based on Climate Division Data from the National Climatic Data Center. Caption by Susan Osborne and Jessica Blunden, adapted from the December 2012 Global Climate Update from the National Climatic Data Center.