Fire fuels in high northern latitudes are becoming more flammable
Details
In the 2020 issue of NOAA’s Arctic Report Card, experts reported on the evolving wildfire landscape across the taiga—the boggy, coniferous forests that occupy much of the high northern latitudes. Rising air temperature and fuel availability over the past 41 years indicate that conditions in Earth’s largest terrestrial biome are becoming more favorable for intense burning and fire growth.
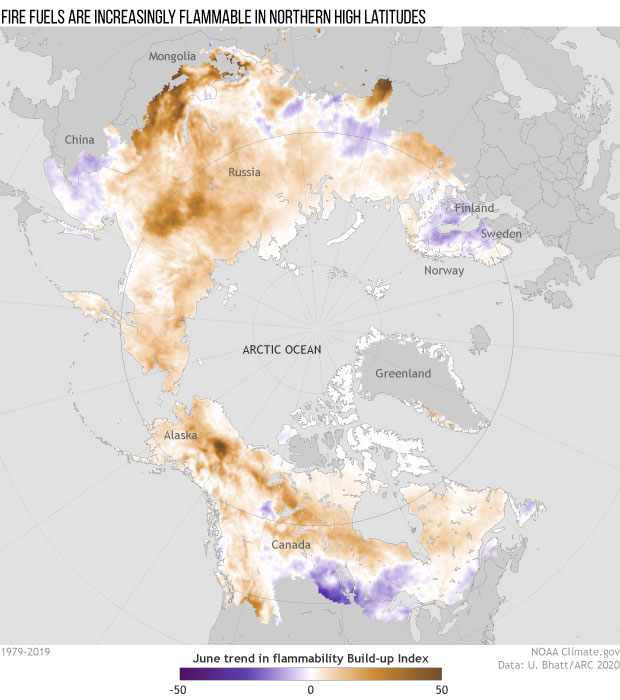
This image shows the buildup index (BUI) trend in June for the 1979–2019 period. The buildup index, an element of the Canadian Forest Fire Danger Rating System, is a numerical rating of fuel availability for fire consumption. Surface temperature, relative humidity and 24-hour rainfall totals all go into the BUI. Brown colors reflect an increasing trend in the availability of fire fuels, while purples reflect a decreasing trend in fuels.
When the BUI reaches certain levels, fires can burn more aggressively and intensely. The widespread increase in the BUI in June in the higher latitudes of both North America and Asia reflect conditions that are becoming more favorable for fire growth. These trends in the availability of dry, flammable fuels for wildfire growth are consistent with wildfire projections for the next century. Up to a four-fold increase in burned area across the higher northern latitude ecosystem by 2100 is projected under a range of different climate scenarios.
In the northern high latitudes, trees aren’t the only fuel available to burn. During the short growing season, thick deposits of moss and dead vegetation—duff—accumulate on the ground without decaying. Under the right conditions they may form deep layers of peat. When these fuels catch fire, they can burn for long periods, sometimes even persisting as so-called “zombie fires”—deep, hot ash pits that overwinter under the snow and emerge again as fires the following spring.
The risk of wildfires extends beyond the immediate threat to life and property. Smoke can worsen air quality, limit visibility, and keep fire suppression aircraft grounded. Black carbon, created by the burning of plant material, can travel thousands of miles across the Arctic, darkening snow and ice where it settles and accelerating melt. And the fires themselves can cause the release of large amounts of greenhouse gases and speed up the destruction of permafrost. Thawing permafrost across the higher latitudes can lead to sinking land and changes in the way water moves through the region.
The occurrence and size of wildfires across the far north can vary greatly on a year to year basis due to the variable nature of weather systems and human activity, but when it comes to fuel availability, the trend is clear. Across most of the taiga, peat and other fire fuels are becoming increasingly flammable, making northern ecosystems more vulnerable to wildfire’s wrath.
Reference
York, A., Bhatt, U., Gargulinski, E., Grabinski, Z., Jain, P., Soja, A., Thoman, R., Ziel, R. (2020). Wildland Fire in High Northern Latitudes. Arctic Report Card: Update for 2020.