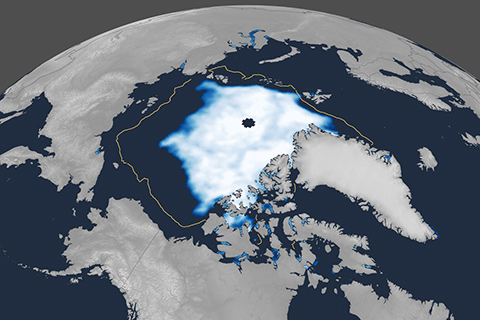
In 2019, the area of the Arctic Ocean where the summer sea ice cover was at least 15 percent tied with 2007 and 2016 as the second-smallest on record.
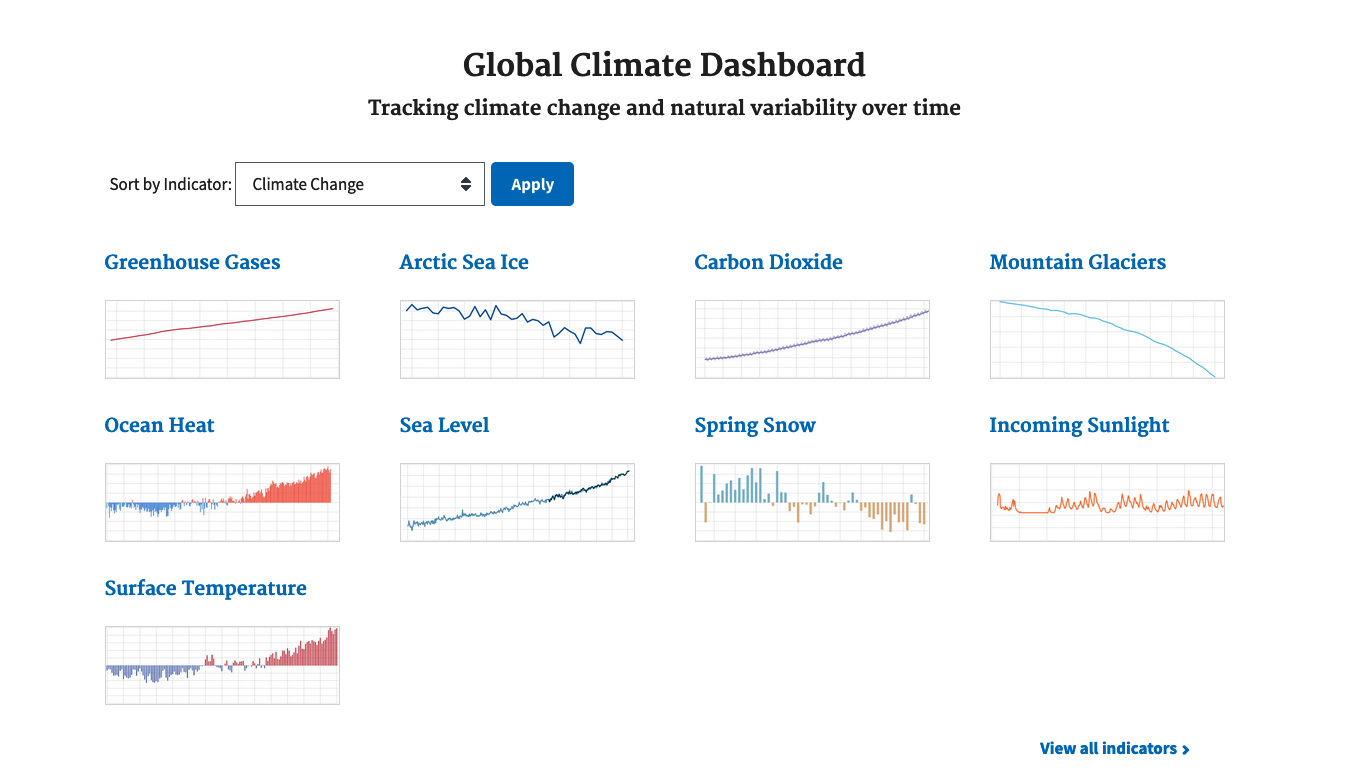
The Global Climate Dashboard provides one-stop access to information, maps, and graphs of key indicators of our global climate. Interactive graphs provide a system-wide view of the state of natural patterns like El Niño and the Arctic Oscillation and those linked to human-caused climate change, such as sea level rise and greenhouse gases.

Thanks to the global oceans, Earth's surface temperature doesn't react instantly to the full impact of a climate disturbance. That delayed reaction has pros and cons.
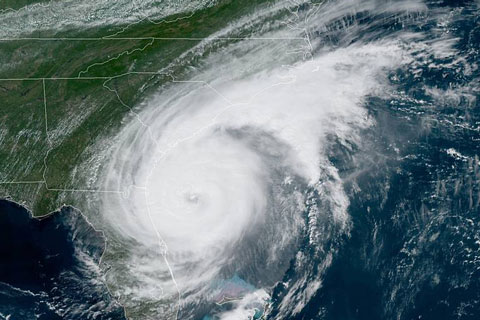
A collection of links to the latest NOAA updates on Hurricane Dorian.
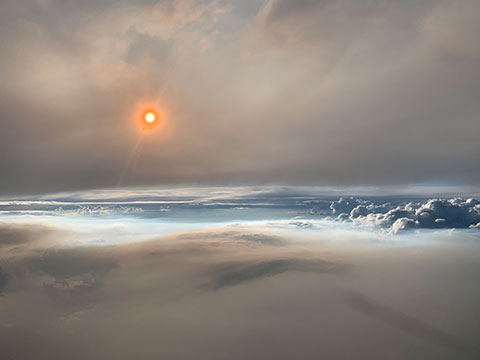
If you missed our August 29 tweet chat, here's the transcript. Read what the fire and smoke experts had to say about the FIREX-AQ field campaign and its mission to study what's in the smoke from wildfires and agricultural burning.
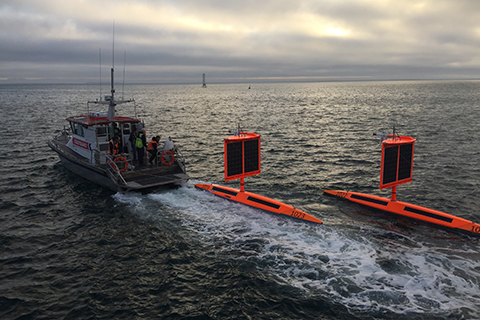
Despite a run-in with an iceberg and the world’s worst sailing conditions, Saildrone 1020 successfully completed its 13,670-nautical-mile journey around Antarctica, and indicated that parts of the Southern Ocean emit carbon dioxide in winter.
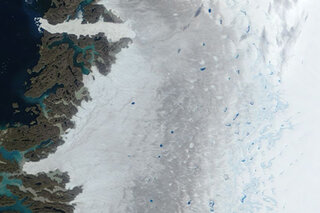
Europe's rogue heatwave melts Greenland
August 14, 2019
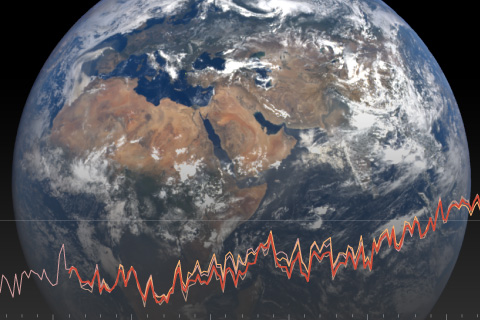
International, authoritative climate report states 2018 was the fourth warmest year on record.

Looking for a sustainable alternative to harvesting wild seaweed, a small California company partnered with a commercial oyster grower to test-farm native seaweeds. The crop reduced pollution and buffered local ocean acidification.

With specially designed sensors mounted on their own cars, volunteers in each city will drive pre-planned routes, recording heat and humidity as they go. Scientists will stitch their results into a detailed map showing the hottest parts of each city.