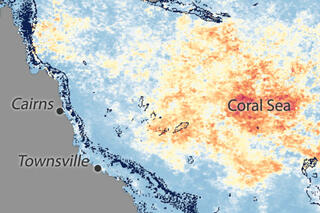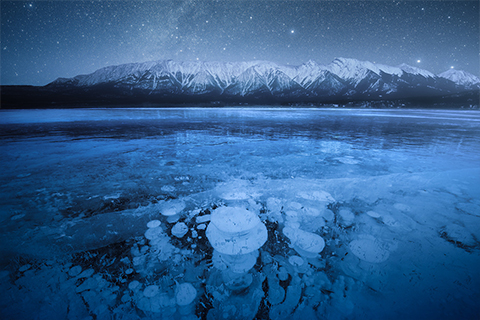
Following a plateau in the early 2000s, global concentrations of the powerful greenhouse gas methane have hit new highs in recent years. Chemical fingerprint tests seem to rule out a major role for fossil fuels. With more than half a dozen possible natural and human sources, how will scientists figure out where it's coming from?
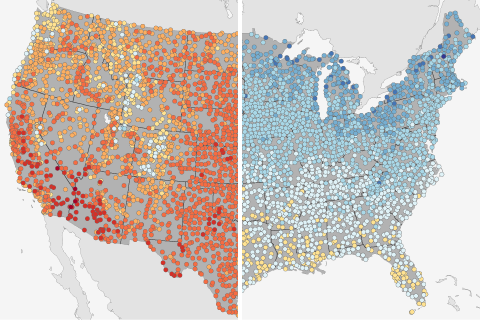
How do this year's temperatures on the first day of summer compare to historical highs and lows? Compare your local conditions to these maps showing the warmest and coldest first days of summer for more than 4,000 U.S. locations.
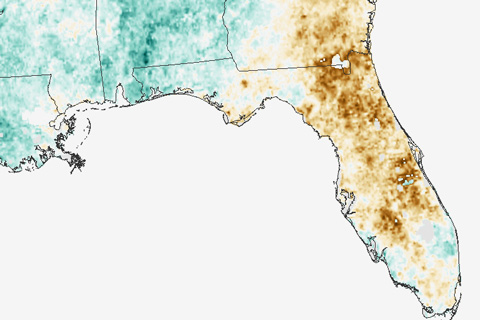
At the end of May 2017, central Florida was the only part of the contiguous United States experiencing extreme drought. These maps come from a new drought surveillance system that can detect vegetation stress without knowing anything about how much it has rained.
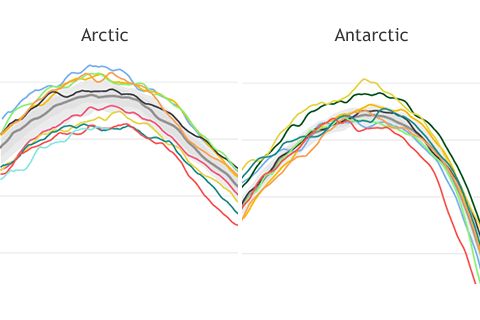
Compared to their smooth appearance at other times of year, the lines tracking Arctic and Antarctic sea ice extent become wiggly. Why is that?
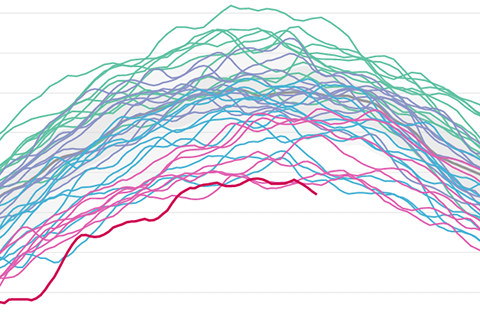
Despite being at opposite points of the annual cycle, the Arctic and Antarctic had something in common in March 2017: record-low sea ice extents.
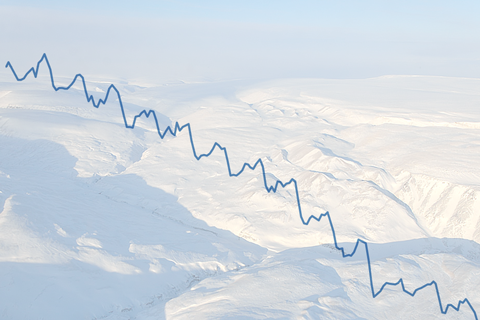
Although surface melt did not set a new record in 2016, the Greenland Ice Sheet did continue a long-term trend of decreasing mass, according to the latest Arctic Report Card from NOAA and its partners.
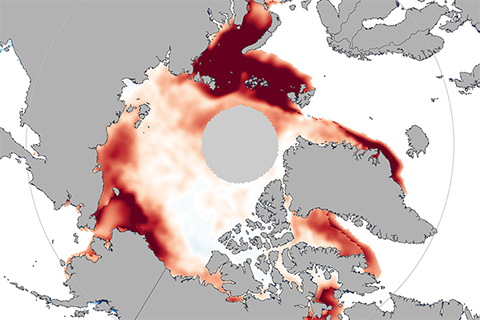
A black swan event is a situation so rare that few people would have imagined it was possible. In November 2016, researchers were caught off guard by just such an event: extremely low sea ice extents in both the Arctic and Antarctic.
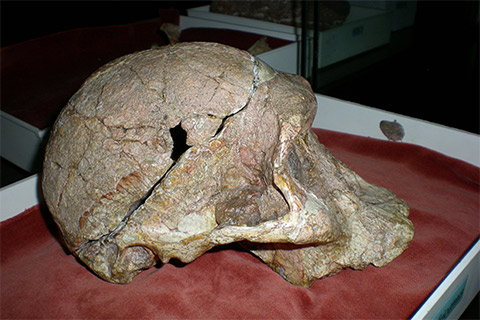
Rick Potts of the Smithsonian Institution discusses the role of climate variation in the evolution of our ancestors.
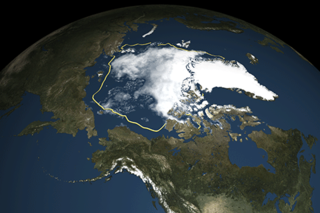
Arctic sea ice ties for second lowest in 2016
September 15, 2016
