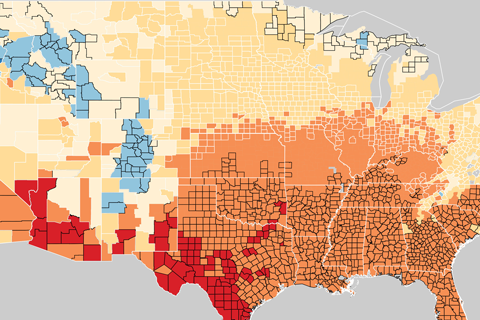
National Climate Assessment map shows uneven impact of future global warming on U.S. energy spending
If the world continues to follow a path with high greenhouse gas emissions, U.S. energy expenditures are projected to increase across much of the Lower 48.
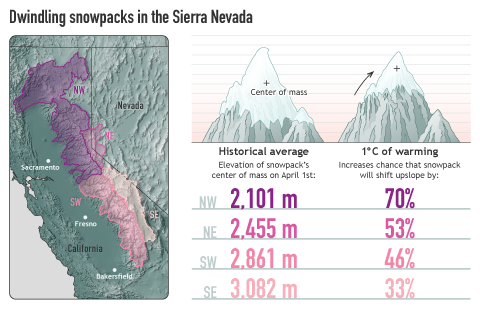
A 1°C (1.8°F) increase in average winter air temperature will have a significant impact on Sierra Nevada snowpack, but different parts of the mountain range will respond differently.
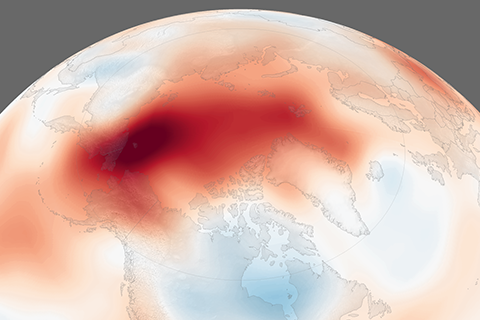
September 2018 was the second-highest on record, and all five years since 2014 have been warmer than any prior records.
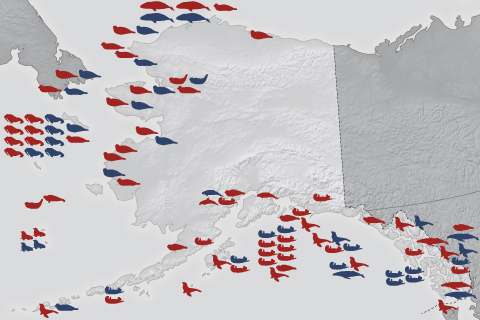
As oceans warm, harmful algal blooms move northward into regions where populations have little or no prior exposure.
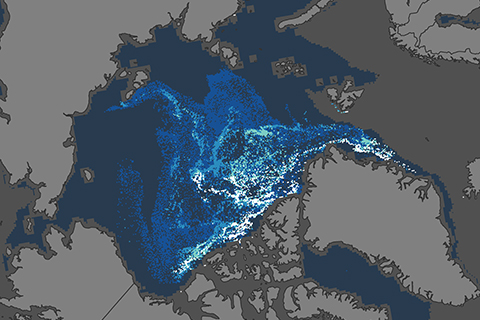
Unlike the rest of us, Arctic sea ice is younger and thinner than it was in the mid-1980s.

From retreating snow elevations to rain-soaked powder, warming due to human-caused climate change will radically transform U.S. skiing over the remainder of the twenty-first century.
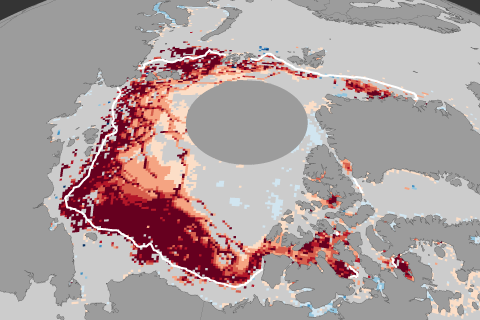
The 2018 Arctic sea ice minimum was not a record low, but it was well below the 1981–2010 average, and it continued the long-term trend of Arctic sea ice decline.
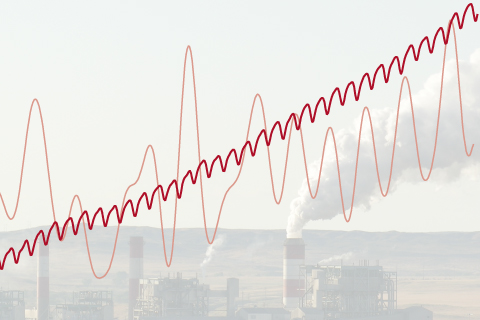
Global atmospheric carbon dioxide reached 405.0 parts per million (ppm) in 2017, a new record high. In the 1960s, the global growth rate of atmospheric carbon dioxide was roughly 0.6 ppm per year. Over the past decade, however, the growth rate has been closer to 2.3 ppm per year.
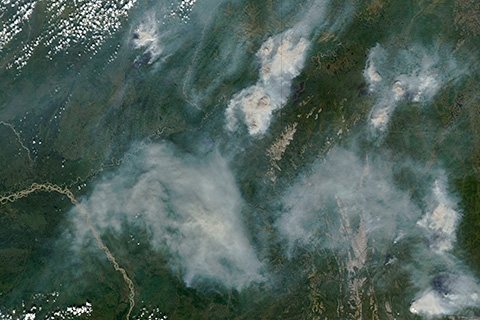
In a sidebar to the State of the Climate in 2017 report, experts describe how human-caused climate change is leading to longer, more damaging fire seasons in the evergreen-dominated boreal forests of Alaska, Canada, and Eurasia.
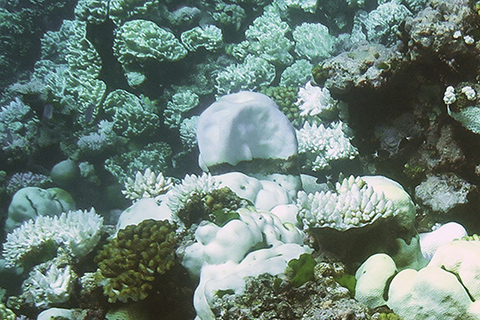
As part of the State of the Climate in 2017 report, experts describe a record three-year-long episode of mass coral bleaching at tropical reefs worldwide. Previous global bleaching events required the presence of El Niño, but the devastating 2014–2017 event began before El Niño emerged and continued long after it ended—implicating human-caused global warming in the mass die offs.