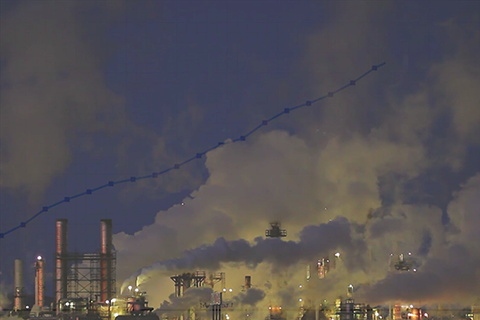
Since 2004, researchers in NOAA’s Global Monitoring Division have released the Annual Greenhouse Gas Index: a single value that compares the total warming effect of each year's concentrations of heat-trapping gases to 1990 levels.
CarbonTracker is a tool for modelling sources and sinks of carbon dioxide. Users can download the code, carbon dioxide data, and the tool's carbon flux estimates to conduct their own analyses or to help improve the system.
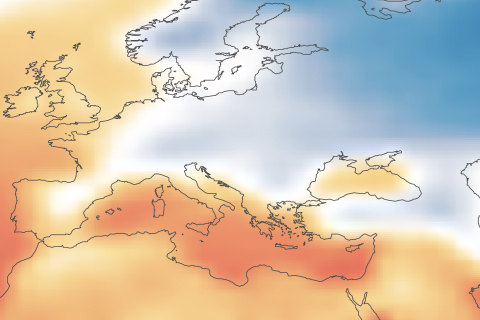
Sochi will be among the warmest cities to have hosted a Winter Olympic Games. Climate change could make many previous Olympic cities unsuitable for Winter Games by the end of the century.
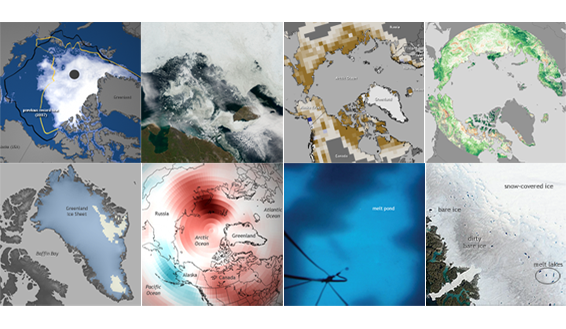
NOAA released the 2012 installment of the annual Arctic Report Card on December 5, 2012, as part of the American Geophysical Union's fall meeting. This image collection is a gallery of highlights based on the report's major themes. It was developed by the NOAA Climate.gov team in cooperation with Arctic Report Card authors and other Arctic experts.

Climate Science 101: What is the Difference Between Weather and Climate?
February 15, 2012

Climate Science 101: Historical Perspectives on Climate Change
February 15, 2012

Climate Science 101: Global Climate Change Impacts in the United States
February 15, 2012
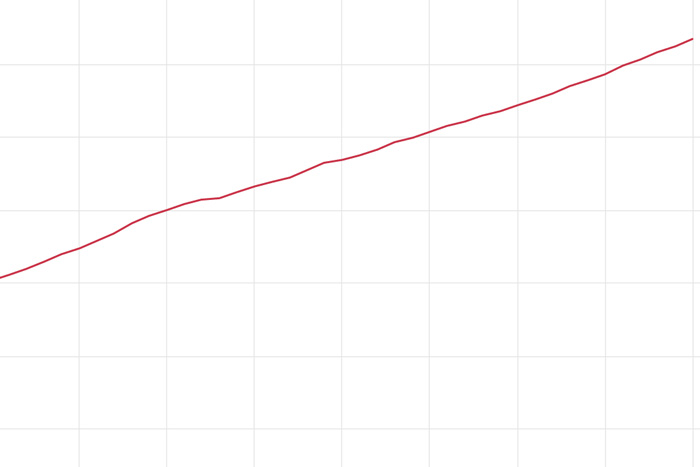
As of 2023, the warming effect of long-lived greenhouse gases in Earth's atmosphere had increased by 51% compared to 1990. Relative to pre-industrial times, today's atmosphere absorbs more than 3 extra watts of energy per square meter.
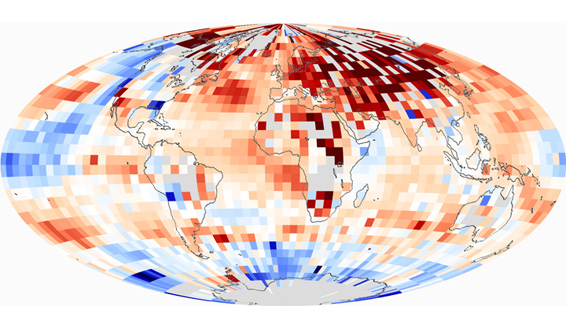
Each of the last three decades was warmer than all earlier decades in the instrumental record, and each set a new and statistically significant record, culminating in the 2000s, which was the warmest decade of all.
