Writing about La Niña, the U.S. and the Jet Stream and THIS HAPPENS. *CLICKBAIT HEADLINE
As Emily wrote two weeks ago, weak La Niña conditions are present and favored to continue through mid-winter of 2017. Even though the La Niña is weak and not expected to last very long, it is only fair here at the ENSO blog to give it and its impacts to the jet stream and to the United States some further elaboration.
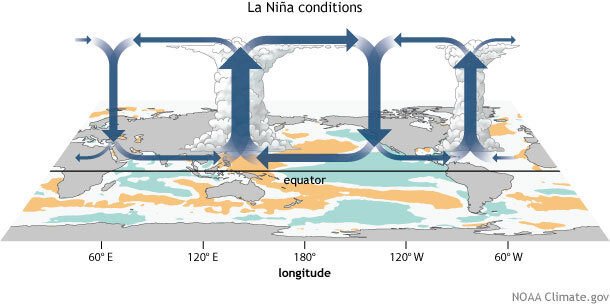
Generalized Walker Circulation (December-February) anomaly during La Niña events, overlaid on map of average sea surface temperature anomalies. Anomalous ocean cooling (blue-green) in the central and eastern Pacific Ocean and warming over the western Pacific Ocean enhance the rising branch of the Walker circulation over the Maritime Continent and the sinking branch over the eastern Pacific Ocean. Enhanced rising motion is also observed over northern South America, while anomalous sinking motion is found over eastern Africa. NOAA Climate.gov drawing by Fiona Martin.
So what about La Niña?
Yeah! What about La Niña? Can’t we show some love to the flip side of El Niño. In a previous post, Tony described, in detail, how El Niño can lead to global impacts through strengthening the Hadley Circulation where air rises near the equator, spreads towards the poles and sinks back to the surface in the subtropics (~30°N/S). This strengthening then changes the strength and position of the jet stream– the area of fast west-to-east moving winds across the mid-latitudes. In another post, I described how ENSO interrupts the Walker Circulation—a circulation along the equator where air usually rises over the western Pacific and sinks over the central/eastern Pacific. So how does La Niña affect the same features and what can that mean for the United States?
The machinations of the La Niña engine
Unlike El Niño, which shifts thunderstorm activity from the western Pacific to the central Pacific and changes the Walker Circulation, La Niña simply ramps up the normal Walker Circulation. This means even more rising air and thunderstorms over the Maritime Continent and even less rain over the central Pacific Ocean. As the humid air rises over the Maritime Continent and cools, water vapor condenses releasing energy into the tropical upper atmosphere in the form of heat. This heating helps to rev up the Hadley Circulation, which affects the jet stream that typically resides near Japan and extends across the North Pacific Ocean.
However! During La Niña, the anomalous sinking air over the equatorial central Pacific Ocean also impacts the location of the jet stream by reducing the west to east flow. Basically, the Pacific jet stream likes to hang out around and north of the subtropics (~30-45°N) near the longitude where stronger thunderstorm activity is occurring over the tropics. For La Niña, that means the jet stream retracts to the west.
An animated gif of the speed and location of the jet stream winds (at an altitude where the pressure is 300 millibars) in three scenarios: (first frame) an average winter (1981-2010), (second frame) La Niña winters, and (third frame) El Niño winters. La Niña winters favor a more northerly track across the United States, while El Niño winters favor a more southerly track. NOAA Climate.gov image based on data from NOAA's Physical Sciences Lab.
In the figure above of winds at the altitude where the jet stream is, it’s clear that the Pacific jet stream, as compared to normal, is shifted west over the western Pacific. What do these changes mean to the U.S. climate?
During El Niño, the jet stream acts like a steep mountain river, flowing swiftly in a straight line across the southern United States from west to east, ferrying soaking storms. During La Niña, the Pacific jet stream doesn’t reach the United States, leaving instead a big area of high pressure south of Alaska, which reduces storms from coming onshore from the west. The southwestern U.S. is often left hot, high and dry.
But the influences of the jet stream don’t stop here. The retraction of the Pacific jet stream can cause ripple effects downstream across the United States. And the easiest way of looking at that is by using the heights at which we reach certain pressure levels in the atmosphere during La Niña and comparing that to normal.
In the heights, brought to you by Lin Manuel Miranda
At sea level, the average air pressure is around 1013mb. In general, the higher you go in the atmosphere, the less actual air there is, and the lower the air pressure. The anomalies above are of the height in the atmosphere where the pressure has dropped off to 500mb. Positive anomalies mean that the 500mb pressure level is higher in altitude than normal. Negative anomalies mean the opposite: that the altitude where the pressure has fallen off to 500mb is lower than usual.
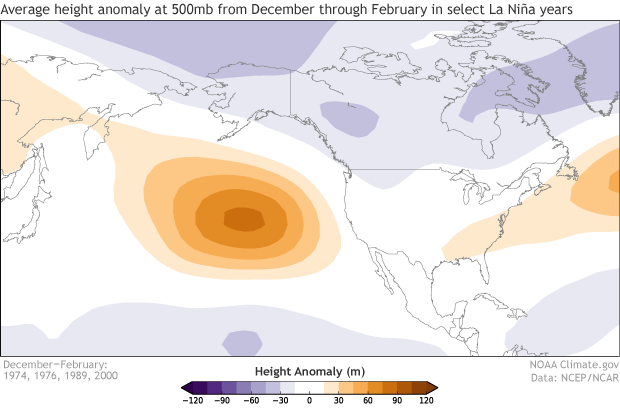
Average height anomalies at 500mb for December through February in select strong La Niña years. Positive height anomalies over the eastern Pacific indicate higher pressure than normal in that region during La Niña winters which can impact the flow of storms and cold air into the United States.
What causes the altitude at which the pressure is 500mb to be higher or lower than average? Think of it like the planet is baking a cake, and the atmosphere is the flour. For a given place’s recipe, earth may normally measure out 1 cup of atmosphere. But sometimes earth measures out 2 cups of atmosphere, other times a half a cup. (Earth likes to eyeball things.) The atmospheric cake gets taller the more flour earth adds, and the 500mb pressure level rises. A positive height anomaly – 2 cups of atmosphere – means that there is more “atmosphere” or “air” than normal in the air column. A negative anomaly means there’s less.
For particularly strong La Niña years where the Pacific jet stream is retracted to the west, left in its wake are positive 500mb height anomalies – more air mass than usual – to the south of Alaska in the North Pacific. These anomalously high heights of the 500mb level are like adding a mountain onto the atmospheric landscape. This new obstacle causes any intrepid traveler – like a storm – to find another way around. All of which seems apropos given that this results in potentially more precipitation for the Pacific Northwest, or the end of the Oregon Trail.
Correspondingly, if the atmosphere moved air to create the unusually high heights, it must have removed it from someplace else. And indeed, the addition of positive height anomalies in the North Pacific sets off a ripple effect farther downstream across North America (1). This ripple effect is the final bridge which connects changes in the atmosphere along the equator to changes in the atmosphere over the United States. To the north of the positive height anomalies are negative height anomalies over western Canada, while downstream over the southeastern U.S., positive height anomalies return.
Where negative height anomalies persist, colder than normal surface temperatures prevail, which mean an increased potential for cold air outbreaks across the north central and northwestern parts of the United States. In the southeastern United States, where positive height anomalies are located, higher surface pressure (more ridging) can shift storms to the north right across the Ohio River Valley.
Cool but could I see this in a more polished, idealized way?
I’m sure you’re thinking “this is great and all, but I’m more of a visual learner and I have places to be, could you simply summarize this in a graphic?” Of course! When we combine and condense the important facts with what we already know happens to the jet stream across the Pacific Ocean during La Niña – and we apply an artistic brush – we get what you see below.
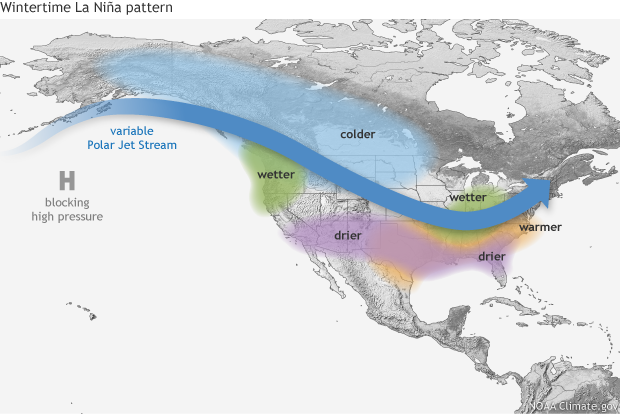
Typical impacts of La Niña on U.S. winter temperature and precipitation. Such impacts have been associated with past episodes, but all impacts aren't seen with every episode. NOAA Climate.gov drawing by Fiona Martin.
A retracted jet stream over the Pacific causes a ripple effect on the atmospheric flow across the United States, which means warmer and drier than average temperatures over the southern U.S. while colder temperatures can filter in across the northwestern and north-central U.S. Wetter conditions prevail in the Pacific Northwest and Ohio River Valley as storms follow around the blocking high in the Pacific or across more northern areas near the Great Lakes. And the southern tier of the United States tends to be drier and warmer than normal as storms keep away.
Standard ENSO caveat applies
Just like El Niño, no two La Niña’s are alike in terms of sea surface temperature anomalies or their changes to the Walker Circulation in the equatorial Pacific Ocean. Their influences on the jet stream and flow patterns across the Pacific Ocean and North America are never the same. The idealized image above is just that, an idealized version of the world we’d expect if the only influence on winter climate were La Niña. As last year’s El Niño showed, ENSO isn’t the only game in town. Which means if you are interested in the latest forecast for the 2016-2017 winter, it’s better to look at the Climate Prediction Center’s forecast, which takes La Niña and everything else into account.
Footnotes
(1) This ripple effect is actually a Rossby wave train that works in a great circle across North America resulting in the height pattern mentioned.
Comments
your 300 mb figures
RE: your 300 mb figures
At first I thought maybe the images had gotten out of order in the code for the rollover, but the wind field over the Maritime COntinent *is* retracted as Tom describes for La Niña, so I think the images are correct, even though you're right that the blocking ridge seems to be less obvious than it is during the "climatology" image. I'll have to let Tom explain that...
Effect farther downstream across North America
What about the wildfires and La Nina?
RE: What about the wildfires and La Nina?
Hi Angela,
You're right, this post was written in 2016, but it's still relevant because it is mostly an explainer on how (i.e. through what atmospheric processes) La Niña tends to affect U.S. winter climate in general. But we have another post that is even more relevant to your question:
https://www.climate.gov/news-features/blogs/enso/what-about-snow-during…
Although all events are somewhat different, on average, La Niña is good for snow in Northern CO, so if we see a typical La Niña, it should be good for fires in the northern mountains of the state.
Add new comment