Western drought: It ain't over 'til...well, it ain't over
Just a few days ago, on January 26th, 2017, we saw something in the U.S. climate that we hadn’t seen since March 2011. Well, technically, we didn’t see something, I guess.
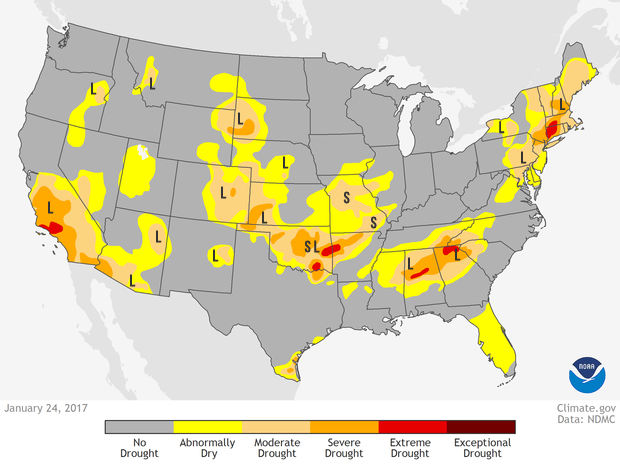
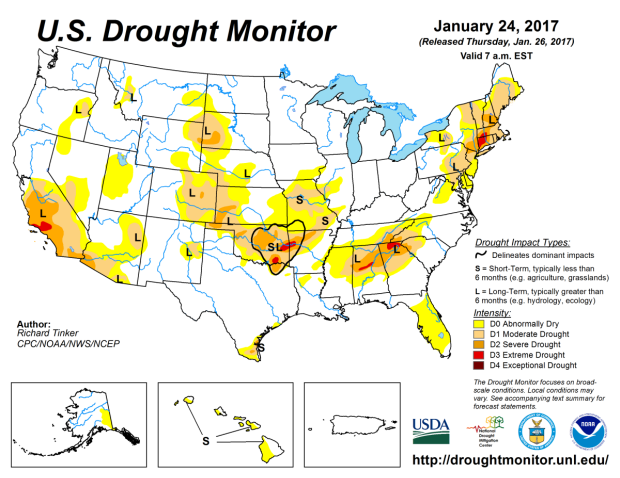
For the first time since March 2011, there was no D4, “exceptional drought,” anywhere in the United States, as analyzed by the U.S. Drought Monitor. The last vestige of D4—the most severe category in the monitoring system—disappeared from its southern California holdout, part of a larger pattern of substantial mid-January drought improvements in California.
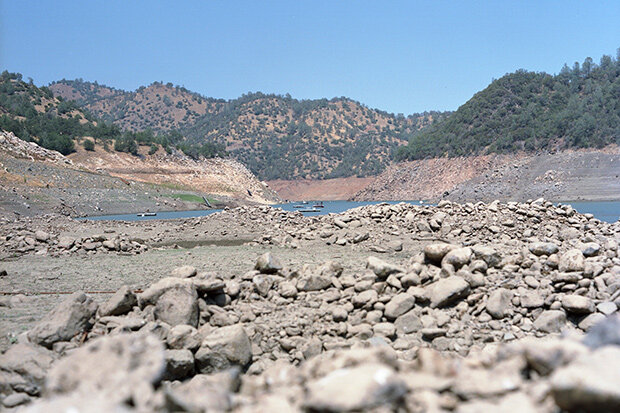
Low water in Don Pedro Reservoir, located in the foothills of the Sierra Nevada about 10 miles west of Yosemite National Park. This photo was taken on October 10, 2014, when nearly the entire state of California was still classified as being drought status D4—exceptional drought. Climate.gov photo by Andrew Williams.
(note: it is always difficult to describe drought improvements as “improvements” knowing they came, as they often do, with the price tag of major flooding and personal tragedy).
With all that said, the bottom line is that the nation is in better shape drought-wise than it has been for most of this decade.
The recap
During late 2015, the West was in pretty dire straits. Drought enveloped most of the region, from border to border, Pacific to Rockies. Late 2015 wetness helped the Pacific Northwest and Northern Rockies, and by spring 2016, drought was almost eradicated there.
However, drought held through spring south of the San Francisco Bay, where summer presents almost zero chance of drought recovery. But things did improve in late fall, and the last month brought waves of rain and high-altitude snow that improved things even more.
This animation shows the evolution of drought, as analyzed by the authors of the US Drought Monitor, since April 2011. Each frame shows a successive April snapshot, with the final frame being as of late January 2017. Drought expanded westward beginning in 2012, becoming entrenched in the region and peaking in 2015.
That’s the update. But going Beyond the Data, let’s stop for a few sidebars.
Sidebar #1: It Ain’t Over / Drought is Complicated
While things are definitely better than they were three months ago, lots of drought remains in the West. The water situation, especially the groundwater situation, is still pretty tough.
We talk quite a bit about scales in climate and meteorology. No, not the kind that give you bad news at the doctor, nor the kind that cover fish, but the kind that describe the bigness and lastingness of things. Orders of magnitude.
Drought sits on the slow end of the time scale, relative to weather systems represented by symbols on weather maps. It’s described over weeks, months, seasons (probably the sweet spot), years and decades. That’s some range.
Various impacts fall out of that range. On the shorter end (weeks to months), we can see immediate impacts. Wildfire danger associated with drought responds (worsens *and* improves) on these scales. Agricultural impacts hang around here too, although maybe not as quick as wildfire. On the long-and-slow end of the scale, we see changes in water supply and ecosystems (not “ecosystem health” but changes in ecosystems, full stop).
These impacts are regimented such that we’ve come up with many lenses to observe drought. Meteorological drought refers pretty straightforwardly to observed precipitation versus expected precipitation. Its tools are pretty useful on the shorter end of the drought time scale. Agricultural drought, as you might expect, refers to plant health and specifically crop health. Its monitoring tools pay a lot of attention to soil moisture. The monitoring tools for hydrological drought are tuned for the long game: measuring change on the year-ish and longer scales.
That brings us back to California. The good news is that there is a very healthy snowpack on the western mountains right now, especially compared to recent years. However, there are still groundwater wells that are moving in the wrong direction in parts of California, particularly southern California. The latest rains literally have not had time to filter down to replenish aquifers. And even when they do, they will be but a blip against the big picture. It’s a point worth dwelling on: weeks of rain will relieve wildfire and agricultural impacts, but we need seasons to years of rain to restore groundwater.
Sidebar #2: Drought in the West is especially complicated
These different scales of drought mean that “drought recovery” means different things for different folks. If you rely on groundwater in the West, you’re still feeling drought, significantly.
Moreover, California and the West have very complex water management systems. That’s a nerdy way of saying that there is lots of plumbing in the West that moves water around and between river basins--sometimes from several states away--to meet people’s needs. Simply put, the law of gravity ain’t the only law determining where water goes.
And the drought in the West doesn’t even date to 2012/13. In the longer term—put on those “hydrologic scale” glasses, please—the drought actually dates back to the late 1990s. In hydrologic terms, dryness dominates the last 20 years.
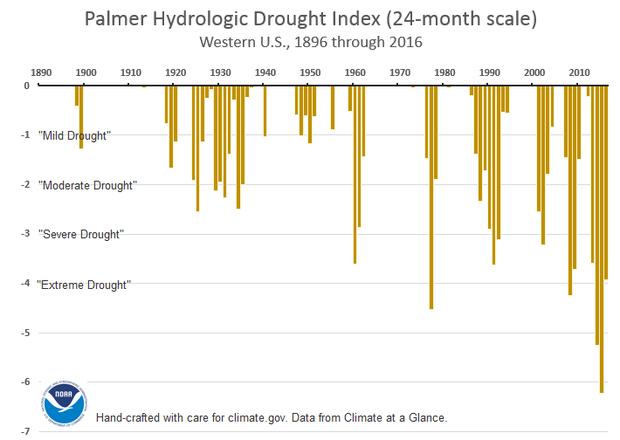
Time series of the Palmer Hydrological Drought Index (PHDI) for the Western United States (California and Nevada). This PHDI index is tuned for changes on the time scale of 24 months. Increasingly negative values (larger bars) indicate increasingly severe drought. The time series shows that, on this multi-year time scale, the region has been in significant drought for the better part of the last two decades.
Add these complicating factors together and you can see that we aren’t out of the woods in the West, even if many westerners have muddy boots this winter.
Sidebar #3: I work with amazing drought pros
If you’ll allow me a couple paragraphs of personal reflection. One of the many rewarding things about serving at the National Centers for Environmental Information is that I work about 20 feet from one of the Legends of Drought Monitoring, Richard Heim. I’m an old drought guy, and considered myself a good one. But Richard is Big League. If the drought monitoring community made action figures, Richard would be in the first set. (sidebar to the sidebar: I’m convinced that drought monitoring action figures is a slam-dunk winner of an idea—who’s with me?).
So, just to acknowledge out loud: thanks, Richard, for your advice on some of the details of this particular article.
Sidebar #4: The climate is changing
Finally, we’ve covered the interaction between drought and our changing climate recently, and in more detail. But it’s worth mentioning again that, as the atmosphere gets warmer, it gets thirstier, and so it levies a bigger tax on soil and surface water.
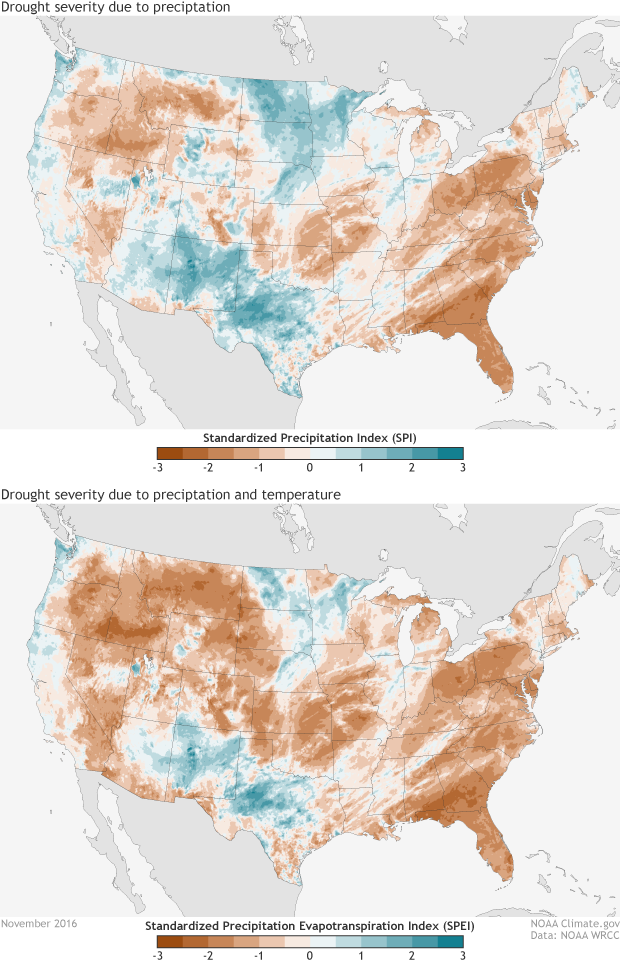
Comparing two drought indices for November 2016 shows the role of warmth in exacerbating dry conditions. The top panel shows the Standardized Precipitation Index (SPI), which depicts drought severity according to the precipitation that occurred during the month. The bottom panel shows the Standardized Precipitation Evapotranspiration Index (SPEI), which depicts drought severity according to the precipitation that occurred during the month (supply), combined with the evaporative stresses (demand) based on temperature. The SPI and SPEI depict severity in terms of unusualness. Increasingly positive values (building to darker greens) indicate more unusual wetness, while increasingly negative values (building to darker browns) indicate more unusual dryness/drought. These maps were adapted from those produced by NOAA's Western Regional Climate Center, using PRISM data
The fact that the recent drought episode spanned the three warmest years on record in California is important. We need to learn from episodes like this to plan for the next drought episode, because …
Sidebar #5: Drought ain’t ever really over
I can make two confident predictions about the drought episodes going on in the US right now:
-
These drought episodes will end
-
There will be more drought episodes in coming years
In the drought world, we often divide up history into “green times” (non-drought) and “brown times” (drought). What we learn during brown times—and, especially, how we act on that during green times—prepares us for the next episode.
Comments
thanks
RE: thanks
Thanks, Johna, I really appreciate it!
Deke
Good info
RE: Good info
Thanks!
RE: Thanks!
Thank you! Much appreciated!
Western drought
RE: Western drought
Hi there, this is a great question, but I think it may be a little hypothetical. First of all, I'm assuming you're talking about North American glaciers.
Seasonal snowmelt certainly is a big part of the western water equation. Seasonal changes and long-term changes to snowpack and the timing of snowmelt are major concerns in the water future of the US Pacific Northwest. With that said, I don't think glacial melt (the melting of much, much older snow that has become ice over decades/centuries) is a significant part of the year-to-year water scene.
So, while North American glaciers are indeed undergoing change and retreat, and there are significant ecological and other ramifications, drought metrics consider that, as they are not really a big component of the water budget on the scales that we apply to operational drought assessment (weeks to years).
(confession: I'm speaking off the cuff here, and my background is mainly in agricultural drought and mostly east of the Rockies. I haven't done any formal homework to answer this question. If I get a note from someone more glacier-minded or Northwestern than me, I'll make sure to follow my comments up here)
But, hypothetically, yes I could see your point that the retreat (or hypothetical advance) occupies a drought timescale that we didn't consider in the article.
Next drought meeting I go to, we could argue about this for days!
Deke
RE: RE: Western drought
Groundwater
RE: Groundwater
Hi, a great place to start monitoring groundwater is via this nifty resouce from our cousins at the US Geological Survey:
https://water.usgs.gov/ogw/
Deke
stuff
The sound of silence.
RE: The sound of silence.
Sorry, comments here have generally turned their collar to the cold and damp.
Add new comment