How ENSO leads to a cascade of global impacts
ENSO arises from changes across the tropical Pacific Ocean. So why does ENSO affect the climate over sizable portions of the globe, including some regions far removed from the tropical Pacific Ocean? Does the strength of ENSO matter for global impacts?
ENSO affects the sea surface temperature (SST) in regions where fishing is a major industry to some countries. A prominent example is the anchovy fishing routinely done off the northwest coast of Peru. When El Niño occurs, the warmed waters become unfavorable for the fish, which flee for cooler waters, resulting in poor harvests that are detrimental to the Peruvian economy.
But the abnormal tropical Pacfic SSTs are only the beginning of the story of ENSO’s impacts. When El Niño occurs, the central and eastern tropical Pacific Ocean becomes warmer than average. With the elevated SST, there is more thunderstorm activity, or convection, than usual over the waters in the central and eastern tropical Pacific. This convection is caused by the increased temperature and moisture in the air right above the warmed water.
This warm, moist air rises to form thunderstorm clouds. The process causes latent heating in the upper atmosphere: heat from the warmed surface of the ocean is released when water vapor condenses into clouds and rainfall. With more storminess than usual, the upper atmosphere becomes warmer than usual, and this extra heat sets in motion yet another series of important effects.
The Hadley Circulation
The rising air in the tropical Pacific can branch away from the equator toward the higher latitudes, both northward and southward, contributing to the complex circulation patterns that help establish the average worldwide climate features. This poleward movement of air in the upper atmosphere, sinking motion over the subtropics, and the return flow at lower levels of the atmosphere toward the lower pressure at the equator, is called the Hadley circulation (see figure).
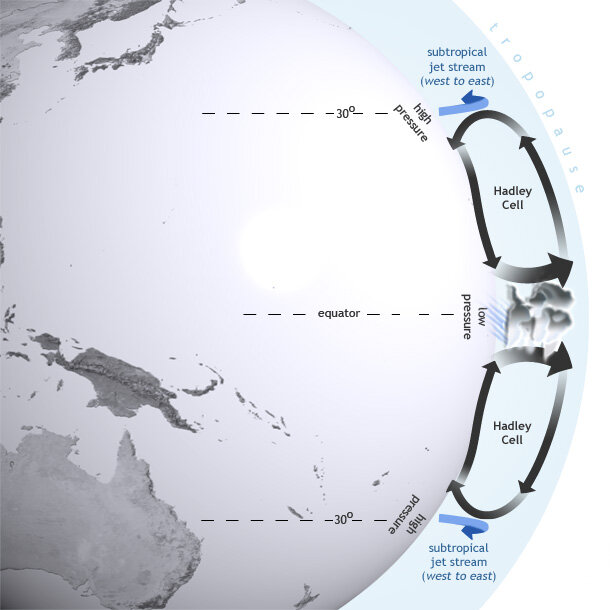
El Niño influences global atmospheric circulation by intensifying the Hadley circulation, in which heat is transferred from the Earth's surface to the upper atmosphere through convection and latent heating. Map by NOAA Climate.gov.
When an El Niño causes excess heating in the tropical Pacific upper atmosphere, the air flow toward the poles becomes more vigorous. The change in the strength of the Hadley circulation leads to modifications in the circulation patterns worldwide, including, for example, the position of the jet stream that flows from west to east over the North Pacific in winter months. El Niño tends to lead to an elongated jet stream that can extend all the way to North America and bring an above-average supply of storms across the southern part of the United States.
Teleconnections
By strengthening the Hadley circulation, El Niño can trigger a cascade of noticeable departures from the normal rainfall patterns around the globe. The changes in the atmospheric circulation, and subsequent ground-level climate impacts, that stretch across the globe are called El Niño teleconnections (see figure). Teleconnection patterns emerge in climate simulations, and they show up in historical observations.
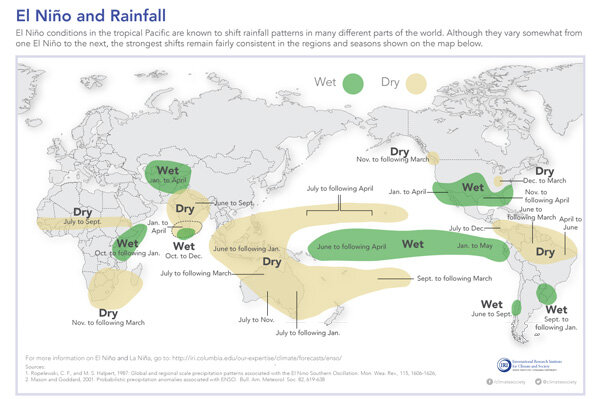
Typical rainfall patterns during El Niño events. Such teleconnections are likely during El Niño events, but not certain. Map by IRI.
Observations since 1950 indicate that impacts during El Niño depend on the season. The figure shows what changes, and during which seasons, El Niño is expected to bring about across the globe. It must be emphasized that while these impacts are likely during El Niño, they are not certain to occur. The stronger the El Niño, however, the more likely the teleconnection side effects become. There is also some correlation between the strength of the El Niño and the severity of the effects (Lyon and Barnston, 2005), but, again, it must be stressed that there are no guarantees here either.
The most reliable effects of El Niño are deficient rainfall over Indonesia and northern South America, and excess rainfall in southeastern South America, eastern equatorial Africa, and the southern US.
References
Lyon, B., and A. G. Barnston, 2005: ENSO and the spatial extent of interannual precipitation extremes in tropical land areas. J. Climate, 18, 5095-5109.
Comments
Indian monsoon and El Nino
el nino impact in my coutry
http://www.climate.gov/comment/22#comment-22
RE: el nino impact in my coutry
RE: RE: el nino impact in my coutry
climate change
this person you gaslight is on spot ~ what we need is more data to include that the global corporations need to invest in nuclear energy and stop nonsense ~ we have investors that would invite nay sayer to look to fission is a dash ....with hydrogen backs ups this is a leap forward in investment and it is on the horizon
watch it because it is truth what you dis as so called Kool the Aid ... spot on about the astro geophysics
correct analsis
need better views of all thank you for you concise words
The Reference is Open Access
El Nino Impact to Pontianak, Indonesia.
Southern California sea temperatures
El Nino affecting trade winds in the pacific?
Cheap goods
Most helpful!
el nino impact in Morocco
el ninio
Add new comment