May 2020 ENSO update: road trip
ENSO-neutral conditions continue and are expected to remain through the fall. Let’s hit the road (virtually) and take a trip around El Niño/Southern Oscillation land! Who needs Carhenge when you have the Walker circulation?
Buckle your seatbelts
Perhaps you recently looked at the table of historical ENSO episodes, where the Oceanic Niño Index is recorded. This index, the three-month-average sea surface temperature anomaly in the Niño3.4 region (anomaly = departure from long-term average), is our primary metric for ENSO. (In climate prediction, we refer to any three-month-average period, e.g. February–April, as a season, so I’ll use that going forward here.)
Perhaps you looked at the table, and perhaps you noticed that the last five seasons, starting with October–December 2019 and going through February–April 2020, are all at or (very slightly) above 0.5°C, and colored red in the table. What’s that about? Was El Niño going on all winter and we were asleep at the wheel? Not so fast.
There are a few things going on here. First, as we are always talking about here on the Blog, ENSO is a coupled system, involving both the tropical Pacific Ocean and the atmosphere. In the case of El Niño, warmer-than-average ocean surfaces in the central and eastern equatorial Pacific lead to more rising air, clouds, and rain, changing the Walker circulation. The atmosphere in turn affects the ocean through changes in the near-surface winds. When the surface temperature anomaly is expected to persist, and the ocean and the atmosphere are both showing characteristic changes, we call this El Niño conditions—and coupled conditions did not persist this past winter.
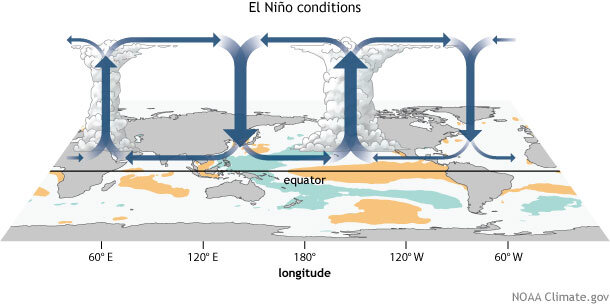
Generalized Walker Circulation (December-February) anomaly during El Niño events, overlaid on map of average sea surface temperature anomalies. Anomalous ocean warming in the central and eastern Pacific (orange) help to shift a rising branch of the Walker Circulation to east of 180°, while sinking branches shift to over the Maritime continent and northern South America. NOAA Climate.gov drawing by Fiona Martin.
There’s no clear threshold where ocean-atmosphere coupling switches on. We have examples in recent years (2014-15 and 2018–19) where the ocean surface warmed up and it took a few months for an atmospheric response to kick in. (Check out Nat’s post and paper investigating the delay.) Those years, the ocean surface was predicted to continue warming, and El Niño was expected. This time around, the Niño3.4 surface temperature anomaly was predicted to hover right around 0.5°C for a few months, but forecasters did not expect the surface to continue warming, nor for the atmosphere to exhibit the characteristic El Niño response.
Highway signs
Stakeholders request a simple, official metric for ENSO and the 0.5°C anomaly in the Niño3.4 region was chosen because it is most representative of ENSO. (Tony covers the history of this choice here.) Usually, the atmosphere responds to a consistent anomaly of 0.5°C or more, but not always. So, occasionally we’ll end up with red on the ENSO table—meaning ocean criteria were met—without evidence of a full-blown El Niño. Such is the agony of borderline conditions!
The world’s tallest haystack
Finally, there’s another issue that is likely coming into play here. The tropical Pacific is experiencing climate change along with the rest of the world, and it’s affecting the “average.” What counts as “average” is getting warmer over time. NOAA uses a 30-year period to define average, and right now that is 1986–2015 for the Oceanic Niño Index. In January of 2021, we’ll update the average period to 1991–2020. Lots more detail here and here.

30-year average periods that NOAA is using to calculate the relative strength of historic El Niño and La Niña events. Climate.gov figure from ERSSTv5 data.
This update will result in changes to the ONI values dating back to 2006. Some seasons that were warm enough to qualify as El Niño when compared to the older (cooler) average won’t be when compared to the more recent (warmer) average. Since winter 2019–2020 was right on the edge, it’s likely that at least one season will drop to 0.4°C, and we’ll no longer have five consecutive seasons at or above the El Niño threshold.
Rest area
The short version of all of the above is “no, El Niño was not present this past winter.” It’s like meeting the age requirement to get a driver’s license, but not passing the written test.
On the road again
Where are we headed next? There’s a 65% chance that ENSO-neutral conditions will last through the summer. As predicted, ocean surface temperature anomalies decreased through April and into May. Winds over the surface of the tropical Pacific, the trade winds, have been stronger over the past few weeks, helping to cool the surface. Also, an area of cooler water beneath the surface has expanded over the past weeks.
Departure from average of the surface and subsurface tropical Pacific sea temperature averaged over 5-day periods starting in early April 2020. The vertical axis is depth below the surface (meters) and the horizontal axis is longitude, from the western to eastern tropical Pacific. This cross-section is right along the equator. Climate.gov figure from CPC data.
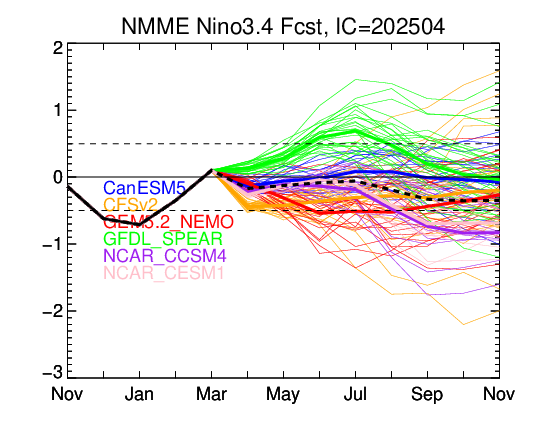
Some of the computer models are hinting at increasing chances for La Niña next winter, although there is a wide range of potential outcomes. Forecasters estimate the odds of La Niña developing in early winter are about equal to the odds that neutral will continue, with lower chances for El Niño.
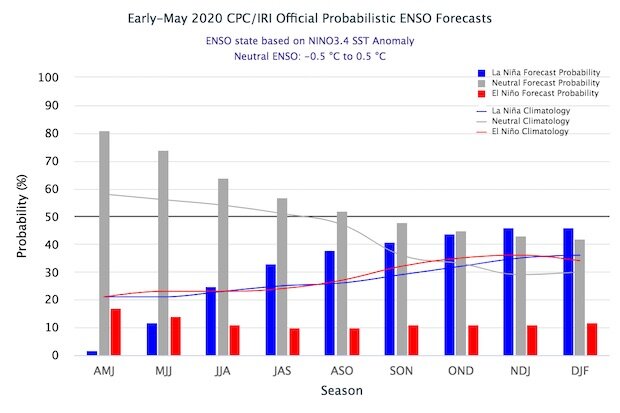
The official CPC/IRI ENSO probability forecast, based on a consensus of CPC and IRI forecasters. It is updated during the first half of the month, in association with the official CPC/IRI ENSO Diagnostic Discussion. It is based on observational and predictive information from early in the month and from the previous month. Image from IRI.
June will find us emerging from the spring predictability barrier, a time where it’s more difficult to accurately predict ENSO development. Nature’s in the driver’s seat, so it’s guaranteed to be an interesting trip.
Comments
La Niña
Drought
La Nina
Add new comment