January 2021 La Niña update: remote destinations
There’s a 95% chance that La Niña will continue through the winter and a 55% chance the tropical Pacific will transition to neutral conditions by the spring. After that, the picture is less clear. Certainly less clear than the waters of the tropical Pacific...
Tahiti
Speaking of, let’s take the temperature of the tropical Pacific Ocean. The December 2020 average sea surface temperature in our primary monitoring region, Niño 3.4, was 1.2° Celsius (2.16˚ Fahrenheit) cooler than the long-term (1986-2015) average, according to the ERSSTv5 dataset. This is comfortably within the La Niña boundary of more than 0.5°C cooler than average.
The cooler-than-average wedge of La Niña is clear in the tropical Pacific, amidst the sea of warmer-than-average we’ve come to expect as the globe warms. However, this La Niña is a bit asymmetric, with more blue to the south of the equator and less to the north than other La Niña events of similar magnitude, such as 2007 or 2010.
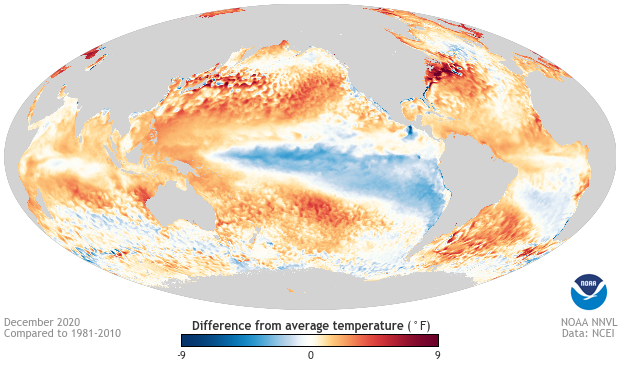
December 2020 sea surface temperature departure from the 1981-2010 average. The cool waters of La Niña are noticeable at the equator in the Pacific. Image from Data Snapshots on Climate.gov.
Also according to ERSSTv5, the three-month average anomaly (the Oceanic Niño Index) was -1.3°C in October–December. Most computer models predict that the Niño 3.4 sea surface temperature anomaly has reached its lowest value in our current La Niña event and will move back toward neutral from here. Forecasters estimate the most likely scenario for the end of this La Niña is a transition to neutral—a Niño 3.4 anomaly between -0.5° and 0.5°C—during the April–June period.
Fiji
Our frequent readers will be familiar with the idea that atmosphere-ocean coupling is the hallmark of El Niño and La Niña. The atmosphere over the tropical Pacific responds to the changes in ocean surface temperature, creating a critical feedback that reinforces the oceanic changes. For a refresher on this mechanism, check out Michelle’s recent post.
In a nutshell, during La Niña we expect a stronger Walker circulation. That is, the cooler-than-average east-central tropical Pacific leads to reduced convection (rising air and cloud formation) in that region, while convection over Indonesia becomes even stronger than average. The trade winds, which blow east to west at the surface, become stronger than average, allowing cooler deep water to upwell to the surface.
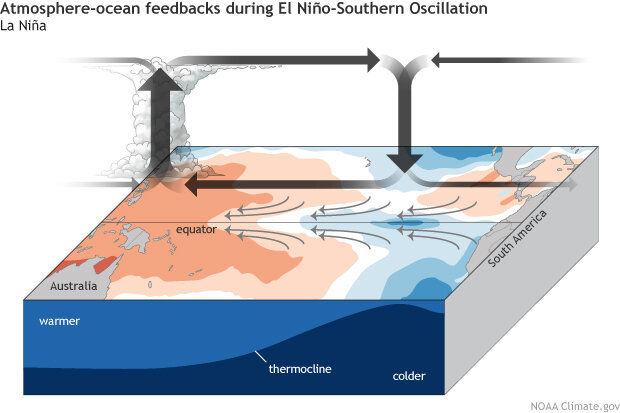
During La Niña, the surface trade winds (small gray arrows) blow more strongly than normal, piling up warm surface water in the western Pacific and drawing up deep, cool water in the eastern Pacific. Over the warm waters, the air becomes more buoyant (upward thick arrow), and rainfall increases. Over the cool waters, it is less buoyant, favoring subsidence (downward gray arrow) and less rainfall. These feedbacks between ocean and atmosphere strengthen the La Niña event. Climate.gov schematic by Emily Eng and inspired by NOAA PMEL.
This winter, both the convection pattern and the near-surface winds have been performing as expected. We can definitely place a stamp on the “strengthened Walker circulation” page of our ENSO passport.
Tuvalu
Speaking of expectations, what about La Niña impacts on global temperature and precipitation patterns? It’s mostly still too early to tell, as the dominant impacts occur during northern hemisphere winter, December–March, and we only have one month on record so far. However, we can take a peek at December’s averages to see how things are shaping up.
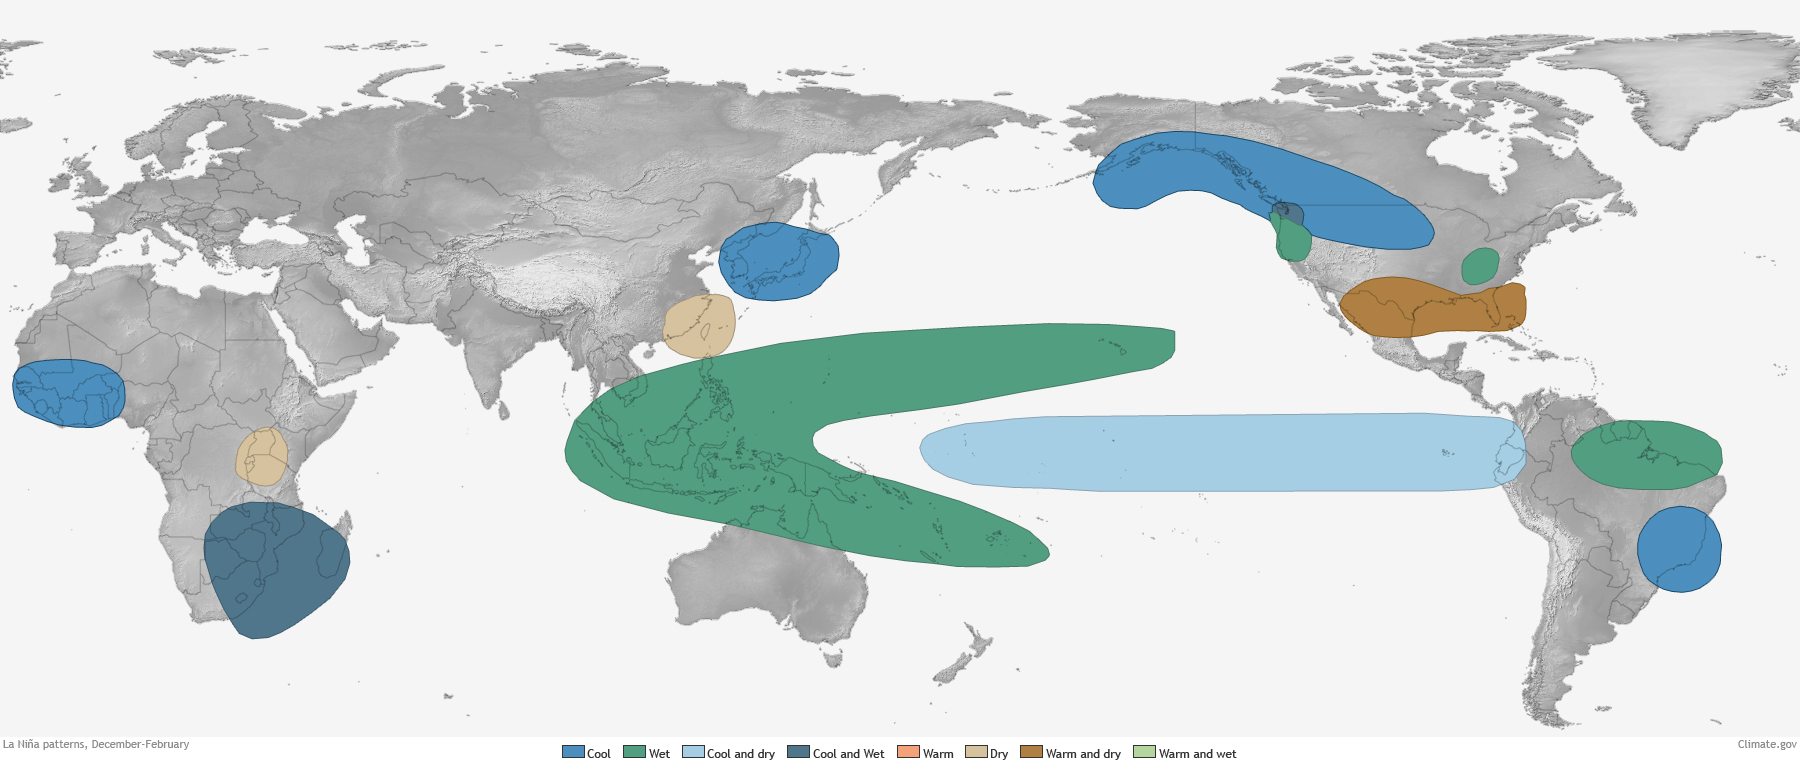
The global precipitation map from December shows that the tropical Pacific was indeed drier than average, with more rain over much of Indonesia. These direct impacts from the stronger Walker circulation are very reliable during La Niña. Remote impacts, or teleconnections, via La Niña’s effects on global atmospheric circulation, are more variable. (Revisit the second half of this post for details on the probability of rain and snow impacts.) So far, southeastern Africa has had more rain than average, and the southern tier of the United States has been a bit drier. Also consistent with La Niña is the pattern of below-average precipitation over eastern Brazil and northern Argentina.
December’s surface temperature map reveals the northern half of North America was warmer than average during December, with Florida the only cooler-than-average region in North America. This is opposite of the expected pattern during La Niña. The temperature map also indicates a large swath of the planet was above average, which is a telltale sign of climate change. However, winter is yet young, and we will see if La Niña may have more of an imprint later on. Revisit Mike Halpert’s recent post on the 2020–21 winter outlook to read more about expectations, and see maps of the U.S. winter temperature and precipitation during the strongest 20 La Niña events since 1950.
Palau
One expected La Niña impact—an active Atlantic hurricane season—certainly happened in 2020. As no one is eager for a repeat of that particular teleconnection, many are asking if we could have a second-year La Niña, neutral conditions, or even an El Niño in the fall of 2021. Overall, the answer is “it’s too soon to tell.” ENSO usually changes phase in the spring, as it’s predicted to do this spring, going from La Niña to neutral. This seasonal phase-change contributes to the spring predictability barrier, a time of year when climate models have a particularly difficult time making successful forecasts many seasons in advance.
That said, currently forecasters estimate similar probabilities of either La Niña or neutral for late summer and fall (around 40-45% chance) and much lower odds of El Niño. These lower odds are consistent with history. If we look at a graph of the eventual fate of every first-year La Niña (meaning, the previous winter did not feature La Niña), we see how rare El Niño is the next winter.
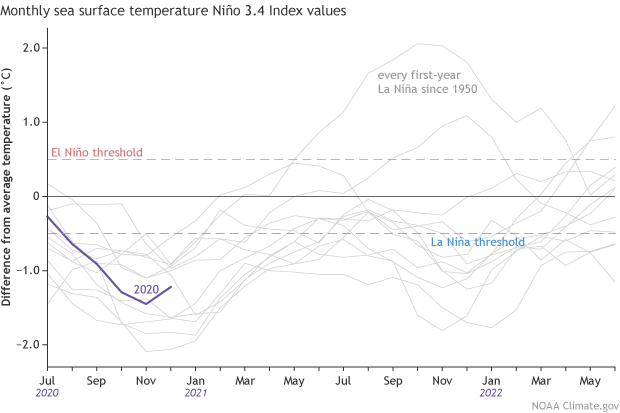
Monthly sea surface temperature in the Niño 3.4 region of the tropical Pacific for 2020 (purple line) and all other years starting from first-year La Niña winters since 1950. Climate.gov graph based on ERSSTv5 temperature data.
In our 1950-present record, a La Niña winter is more often followed by either neutral or weak La Niña conditions during the summer, with a re-development of La Niña the subsequent winter.
Of the 12 first-year La Niña events, 8 were followed by La Niña the next winter, 2 by neutral, and 2 by El Niño. We’ll probably have to get through the spring predictability barrier before we can make a more confident prediction about next fall. In the meantime, you can be sure we’ll be closely monitoring the tropical Pacific, while dreaming about swimming in it.
Comments
SSW
RE: SSW
Thanks, Walt! And stay tuned... Michelle has a post about the current SSW that will be published January 28!
La Nina Winters Let It Snow in North Texas
RE: La Nina Winters Let It Snow in North Texas
Mild Winter Impact
RE: Mild Winter Impact
Thanks for the question. It's difficult to see how this particular "flavor" of La Nina would have caused the December temperature pattern to deviate so much from the typical La Nina temperature pattern. More likely, random weather variability was a bigger culprit. However, it is an interesting question about whether the uniqueness of this sea surface temperature pattern had some sort of impact on the December temperature pattern. At this point, we can say it's possible but it would require an in depth investigation.
How does it affect the Indian subcontinent?
RE: How does it affect the Indian subcontinent?
Generally, La Nina causes increased Indian monsoon rainfall, but that is not a guarantee. Please see Tom's previous blog post and Rebecca's article for more information.
Add new comment