Is ENSO running a fever, or is it global warming?
I want to kick off this blog post by introducing you to a force of nature in the climate community, Geert Jan van Oldenborgh. He just got recognized by the European Meteorological Society with a Technology Achievement Award for building the KNMI Climate Explorer. This website, which you can access at https://climexp.knmi.nl/, is a great way to plot and play with climate data. Give it a whirl!
Geert Jan isn’t just a talented web programmer and data manager—he is also a prolific climate scientist who has been working with me and several of our colleagues on a matter of increasing importance. Our collaborators include the Bureau of Meteorology in Australia (BOM), European Centre for Medium Range Weather Forecasts (ECMWF), and the international Red Cross Red Crescent Climate Centre.
Global warming has become increasingly prominent in our ocean temperature datasets. It is difficult to look at a map of sea surface temperature (SST) across the globe and not see that global maps are often awash in red color, reflecting above-average temperatures. This includes the tropical Pacific Ocean, where differences from average sea surface temperature (or SST anomalies) are the key ocean indicator for El Niño (warmer) and La Niña (cooler).
At the Red Cross Red Crescent Climate Centre, these tropical Pacific sea surface temperature anomalies are tracked using the Niño-3.4 index (or the Oceanic Niño Index (ONI), which is the seasonal average of Niño-3.4). This index, or time series of ENSO variability, is used as an early warming indicator for El Niño and La Niña- related climate disruptions that might require humanitarian aid. They realized that the presence of global warming in SST-based ENSO index may be resulting in over or under-preparation for unusual rainy seasons (you can read more about this in Geert Jan’s open-access article).
All warming is not equal
For monitoring ENSO, everything depends on how conditions compare to average. But what does “above average” temperatures actually mean? Well, until recently, it meant relative to the average of ocean and atmosphere conditions over the 30-year period from 1981-2010. But every ten years, NOAA and other agencies update the averages to a period that is closer to the present. So, now we’re using 1991-2020. Across much of the planet, the newer base period average is often warmer than the older one thanks to global warming (but not everywhere, or for every season). Check out this graphic that our friends at NCEI have put together!
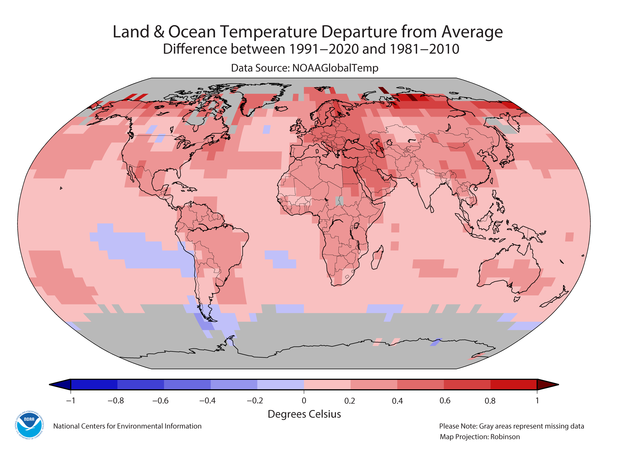
Annual mean temperature differences between the newer base period (1991-2020) and the older base period (1981-2010). Red shading indicates locations where the newer base period is warmer than the older one. Figure courtesy of Ahira Sanchez-Lugo (NOAA NCEI). Data from NOAAGlobalTemp.
Updating the averaging period helps us keep pace with changes over the last decade, but as it turns out, a climatology based on the last 30 years can still be a little dated as far as ENSO is concerned. Why is this a special problem for ENSO? Because the short-term, localized temperature changes that occur during El Niño and La Niña events have a different impact on the global climate than the long-term, all-over warming caused by rising levels of atmospheric greenhouse gases. In other words, not all warming is equal. So we don’t want to be mixing up the two when we measure ENSO. It can be confusing!
To give a concrete example, remember the not-so-distant winter of 2019-20? Well, Emily Becker still has flashbacks because she had to do a monthly dance to explain why positive values in the Niño-3.4 index and above-average SSTs can look like El Niño across the tropical Pacific Ocean, but actually were not El Niño. Why not? Mainly, the patterns of tropical convection and winds were not matching up with the SST pattern. And because ENSO is a coupled atmosphere-ocean pattern, we need the atmospheric circulation to lock in and persist (this is part of our ENSO Alert System). It was a close call, but we just didn’t see what we needed to declare El Niño in 2019-20. We had a similar problem in 2014-15 when SSTs were above average for certain seasons, but it was not reflected in the atmospheric circulation.
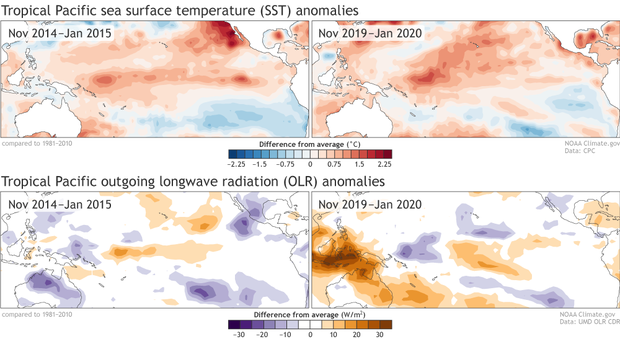
Anomalies (departure from average) of sea surface temperature (SST) and outgoing long wave radiation (OLR) for November 2014-January 2015 (left column) and November 2019-January 2020 (right column). Red shading indicates where SSTs are above average and blue shading is where SSTs are below average. Orange shading indicates where tropical cloudiness and rainfall is below average and purple shading is where tropical cloudiness and rainfall is above average. NOAA Climate.gov figure using data from NOAA CPC.
So what can we do about it?
Geert Jan and Harry Hendon were chatting one day and realized that ENSO monitoring could be better handled by using relative sea surface temperature anomalies (footnote #1), taking the anomaly in the Niño-3.4 region and subtracting the anomaly for the entire tropics. Turns out removing the tropics-wide anomaly helps shine a bigger spotlight onto the local regions of relative warming or cooling that are more directly tied to locations of enhanced or suppressed tropical rainfall.
This works because in the tropics, changes in rainfall are more sensitive to the differences (or gradients) in temperature across the surface of the ocean. Where waters are warmer relative to the tropical average, there is more rising motion, increased cloud formation, and rainfall than where waters are relatively cooler, sinking, and drying (same principle as why your basement tends to be cooler and your attic warmer—see footnote #2 for the Finnish equivalent).
So, for determining the location of where tropical rainfall increases or decreases, it doesn’t matter as much that the global tropics are gradually warming up as it does the existence of relatively cooler or warmer temperatures on the ocean surface. Because coupling between the atmosphere and ocean is linked to tropical rainfall changes, relative SSTs help us better identify those regions that are more closely tied to shifts in the atmosphere and coupling that are fundamental to ENSO!
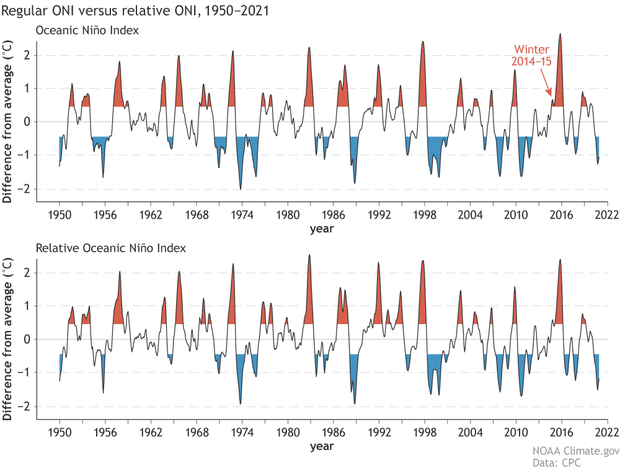
The top panel shows the time series of the Oceanic Niño Index (ONI), which is the seasonal average of sea surface temperature anomalies in the Niño-3.4 region of the east-central equatorial Pacific Ocean. ONI values are also provided in this table and here. The bottom panel shows the Relative Oceanic Niño Index, which can be found here. Both indices show all three-month average (seasons) overlapping starting in December-February (DJF) 1949-50 to DJF 2020-21. Red shading shows El Niño episodes and blue shading shows La Niña episodes (thresholds must be exceeded for at least 5 consecutive, overlapping seasons). NOAA Climate.gov figure using data from NCEI ERSSTv5.
Getting back to our 2019-20 “False positive El Niño,” the relative SST index clarifies this situation and shows that the tropical Pacific was more in line with ENSO-neutral. The same is true for 2014-15 when there was a lack of SST gradients and corresponding changes in the atmospheric circulation and rainfall that were missing. The relative ONI simply does not identify those periods as El Niño (footnote #3).
Not only does relative ONI help reduce the amplitude of warm Niño3.4 conditions by removing an unrelated and therefore unwanted contribution from global warming, but it also strengthens some recent La Niña events that would have otherwise been considered stronger if not for the presence of climate trends (2016-17 and 2017-18).
Going forward, you can count on the NOAA/IRI ENSO team to also take in account the relative ONI when updating the current ENSO status. For now, the current ONI table will remain as is, mostly because our model forecast guidance is also in terms of non-relative anomalies. But don’t be surprised if you start seeing relative SSTs more often in the future!
Footnotes
- Relative SSTs is not a new concept—it has been applied to other problems like tropical cyclones-- and in fact, is something that one of our fellow ENSO bloggers is deeply familiar with. Nat Johnson did some key research with Shang-Ping Xie and Yu Kosaka to set the stage for relative SSTs in the tropical Pacific Ocean. See the reference list below for other key papers that discuss relative SSTs.
- In reviewing this post one of my European collaborators pointed out that this analogy really only works for a well-insulated house on a cloudy winter day. This is true—here, we’re more concerned with the density of air. Cold air is denser than warm air, so cold air usually sinks while warm air rises. We’re not talking about the direct warming of the attic due to sun on the roof and cooling of basements due to cooler earth around it. A better example that works well in northern Europe is the difference in temperature between floor and ceiling in Finnish saunas. And, yes, if you needed any more evidence we take this blog seriously, we even debate our analogies!
- A period is defined as an El Niño episode when at least 5 consecutive overlapping seasons (3-month averages) are at or greater than 0.5°C. La Niña episodes are when at least 5 consecutive overlapping seasons are at or less than -0.5°C. Episodes are shaded red and blue in this historical table.
References
- Back L E and Bretherton C S 2009 On the relationship between SST gradients, boundary layer winds and convergence over the Tropical Oceans J. Clim. 22 4182–96
- Izumo T, Vialard J, Lengaigne M and Suresh I 2020 Relevance of relative sea surface temperature for tropical rainfall interannual variability Geophys. Res. Lett. 47 e2019GL
- Johnson N C and Xie S-P 2010 Changes in the sea surface temperature threshold for tropical convection Nat. Geosci. 3 842–5
- Johnson, N.C., Kosaka, Y. The impact of eastern equatorial Pacific convection on the diversity of boreal winter El Niño teleconnection patterns. Clim Dyn 47, 3737–3765 (2016). https://doi.org/10.1007/s00382-016-3039-1.
- Ramsay H A and Sobel A H 2011 Effects of relative and absolute sea surface temperature on tropical cyclone potential intensity using a single-column model J. Clim. 24 183–93
- van Oldenborgh GJ, Hendon H., Stockdale T., L'Heureux M., Coughlan de Perez E., Singh R., and van Aals M. 2021 Defining El Niño indices in a warming climate. Environ. Res. Lett. 16 044003.
- Vecchi G A and Soden B J 2007 Effect of remote sea surface temperature change on tropical cyclone potential intensity Nature 450 1066–70
Comments
or is it global warming
I would not blame this on global warming if an El Nino event were to form. Maybe consider elsewhere in regards to possible relationships or forcing mechanisms. Just a thought. Even neutral warm would go against the models from a while back. Most were leaning for a 2 year event. We should know by August at the latest in regards to whether or not an El Nino is actually going to form.
No
You are not helping, I need Average Wind Speed (km/h) but you are not helping!!!!!!!!!!!!!!!!!!!!
RE: No
Hi Tom. For questions that are not related to the ENSO blog, please use the contact email for general data questions:
climate-dataandservices@noaa.gov
Archived weather data
My wife and I are big fans. KVOA TV was very lucky to find you. I have a weather question pertaining to archived weather data going back to August 5th 2019. Would that data be so accurate that it could document every area
a hailstorm occurred. Whether it was a short powerful burst lasting 5 to 10 minutes and other hailstorms short or long going on at the same time in other parts of Tucson. Could that kind of data be gathered with the utmost of certainty.
I would be so very interested in your opinion. And I would be happy to explain the reason for my question if you are interested.
You do your job so well and it genuinely shows.
Thank you for considering my question. Kevin McConnell RN
RE: Archived weather data
Thank you for the kind words, Kevin! Regarding your question, I am unaware of any datasets with the level of accuracy and specificity that you seem to be requesting. Nevertheless, the National Centers for Environmental Information do have a Storm Events Database that has pretty detailed records of reported severe weather, including severe hail storms. I suggest that you check out the database through the provided link and see how close the information provided comes to meeting your needs.
RE: RE: Archived weather data
I'll also add that your local National Weather Service office might be able to help you with this question as well. For Tucson, that office is https://www.weather.gov/twc/ and their email address can be found by scolling to the bottom of the page to the "contact us" area of the footer.
Good Info
Is CPC posting relative ONI on the website? This seems to be a good way of tracking ENSO in our warming skewed situation. Thanks for the interesting and useful info, Michelle!
RE: Good Info
Hi Brett!
Yup! You can find the Relative ONI here https://cpc.ncep.noaa.gov/data/indices/
dhasdh@gmail.com
I agree! Climate change is increasing the frequency of extreme El Niño events, leading to intensifying droughts, worsening floods, and shifting hurricane patterns, according to a new study published in the Proceedings of the National Academy of Sciences
Global Warming
It found that a clean white roof that reflects 80% of sunlight will stay about 31C cooler on a summer afternoon.
The conditions would be very different in California to those found in India - where more than 60% of roofs are made from metal, asbestos and concrete, which trap heat inside buildings even when treated with a white coating.
Why?
Why do people use ONI (3 month average) instead of the SST in Nino3.4 for data analysis? It was my understanding that running averages are good for making pretty graphs but when you build your model, you should use raw data.
It depends!
Whether or not we want to use smoothed data (like by taking a 3-month average) or nearly instantaneous (such as daily) data depends on the purpose of your analysis. In the case of ENSO, which is a slowly evolving climate phenomenon, it's advantageous to average out some of the daily and weekly noise of SST variability in the Nino 3.4 region that is unrelated to ENSO (and instead may be related to other phenomena like tropical instability waves). So, in this case, the 3-month-average filter applied with the ONI helps to bring out the ENSO signal more cleanly from the noise of unrelated variability. If, however, you were interested in some weather or biological phenomenon that responds to instantaneous Nino 3.4 region SSTs, whether or not it's tied to ENSO, then it would be better not to use the ONI and instead to use the daily or monthly Nino 3.4 SST. Like with so many applications, the best form of the data depends on purpose.
Comments have been disabled on this article