Tools & Interactives
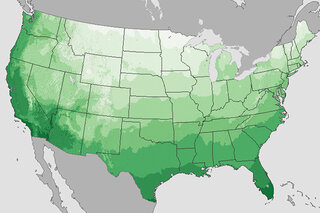
Web map of climate-related planting zones layers based on annual minimum temperatures from 1971-2000, 1981-2010, and the change between the two periods.
View this toolWeb map of warmest first day of spring (March 19) recorded at thousands of U.S. weather stations, based on Global Historical Climatology Network data.
View this toolCompare Arctic sea ice concentration in early and late July 2017. The later image shows a clear retreat of sea ice throughout the Arctic Ocean, especially north of Russia.
View this toolCompare infrared-enhanced false color satellite imagery, good for actively burning areas, to natural color, which shows the smoke plume spreading northeast from the fire.
View this toolWeb map of coldest first day of spring (March 19) recorded at thousands of U.S. weather stations, based on Global Historical Climatology Network data.
View this toolCompare the before and after images of the greenness across northern Europe in 2018. Hot and dry conditions turned many green fields brown as the summer progressed.
View this toolDrag slider to view images of California on Oct. 5 before the fire, and on Oct. 10, when multiple wildfires raged north of San Francisco.
View this toolPredicted number of high tide flooding days in 2018 for almost 100 locations along the East and West Coast of the United States, the Caribbean, and Pacific Ocean.
View this tool


