Can we detect a change in Atlantic hurricanes today due to human-caused climate change?
Christopher W. Landsea is the Chief of the Tropical Analysis and Forecast Branch at the National Weather Service's (NWS) National Hurricane Center (NHC) in Miami, FL. Tom Knutson is a Senior Scientist at NOAA’s Geophysical Fluid Dynamics Laboratory (GDFL) in Princeton, NJ. The following discussion represents the authors’ opinions only and does not represent any official position of NHC, NWS, GFDL, or NOAA in general. A NOAA State of the Science Fact Sheet on “Atlantic Hurricanes and Climate”, which has been reviewed by NOAA, is also available.
Last summer, one of us (Chris) co-wrote a National Hurricane Center Inside the Eye blog post about the 2020 hurricane season and whether it was truly as “record-breaking” as it seemed. We also talked about how an apparent doubling in the number of Atlantic tropical storms and hurricanes over the past century is more likely due to better observation technology than to actual increases in storms from natural or man-made climate change.
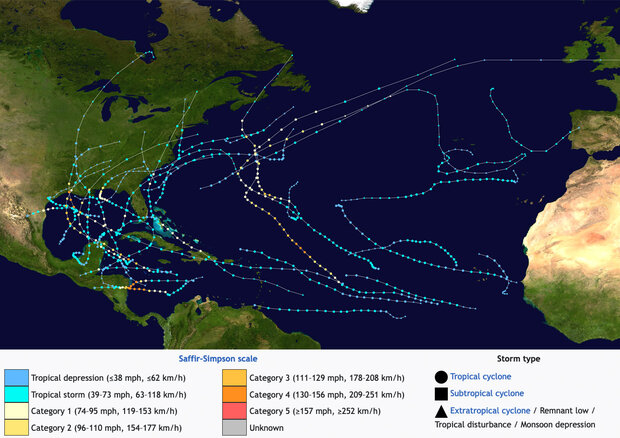
Tracks and intensities of storms during the exceptionally active 2020 Atlantic hurricane season. Map by Wikimedia user MasterOGarfield, based on NOAA hurricane track data.
Likewise, we think that better storm tracking played a significant role in the boost in what counts as average or “normal” conditions from 12 to 14 named storms as the National Hurricane center shifted its baseline from 1981-2010 to 1991-2020. Satellites and other technological advances allow the National Hurricane Center to observe and accurately diagnose more weak, short-lived named storms than had been done previously.
In this blog post, we address the more general question of whether scientists can detect any significant change in observed Atlantic hurricane activity due to man-made climate change. This involves a careful analysis of observations, data quality, and modeling results.
Observed Long-Term Changes in Atlantic Hurricanes
As discussed in the previous blog post, when looking for evidence of climate change in past records of hurricanes and tropical storms, one has to account for “missing” tropical systems that occurred in the past but were not recorded due to lack of satellite imagery. For example, the figure below—from a new study by the authors and colleagues (Vecchi et al. in 2021’s Nature Communications)—provides a best estimate of how many hurricanes occurred over the North Atlantic Ocean, Caribbean Sea, and Gulf of Mexico back to the 1850s, including an estimate of “missing” storms.
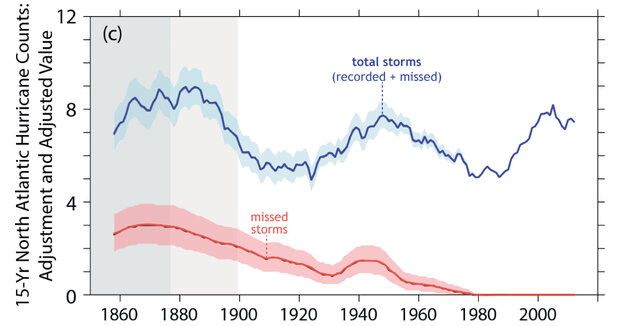
(red line) An estimate of the number of tropical cyclones in the Atlantic basin (15-year running average) that were likely missed early in the historical record due to sparse observations. (blue line) Total number of Atlantic hurricanes, including those that were recorded and those that were likely missed. Image adapted from Vecchi et al., 2021.
The red line in the figure above is the estimated number of “missed” hurricanes from the Vecchi et al. (2021) study, with the red shading showing the uncertainty in those estimates. The blue line is the total number of hurricanes (both observed and estimated missed) in a centered 15-year average, derived from the years 1851-2019, with the blue shading showing the uncertainty. The dark and light gray shadings before 1900 provide a caution that this approach is more uncertain during the 19th Century than the 20th Century for estimating the total number of hurricanes per year.
The graph shows distinctly busy and quiet periods: higher hurricane numbers in the late 19th century, mid-20th century, and from the mid-1990s onward, but lower numbers in the early 20th century, and in the 1970s to early-1990s. It’s also worth pointing out that there is no significant trend upward in the estimated total number of hurricanes. Chris also demonstrated (in 2015’s Bulletin of the American Meteorological Society) that the number of hurricanes affecting the U.S. (with no adjustments required) shows no significant trend since 1900, in agreement with the Vecchi et al. basin-wide estimated reconstructions and with updated U.S. landfalling hurricane and major hurricane time series.
There is a good understanding of the environmental conditions that accompany these decade-to-decade swings in hurricane activity. For example, the depiction below from a 2007 paper in the Bulletin of the American Meteorological Society by Jim Kossin and Dan Vimont shows “active” hurricane-season conditions on the left versus “quiet” on the right. The locations where tropical cyclones start are superimposed on maps of difference from average ocean temperature (colors) and wind shear (lines). Crosses show starting points for all storms that reached at least tropical storm strength. Circled crosses show starting points of storms that reached “major hurricane” strength, with peak winds of at least 111 mph (178 kph).
One can see that active hurricane seasons correspond to warmer waters (shaded yellow to red) and less wind shear (dashed contour lines) from 5oN to 25oN, while quiet years have opposite conditions along the same latitude belt. Additionally, busy seasons also have lowered surface pressure and a more moist, unstable atmosphere conducive for thunderstorm development; quiet years display higher pressures and a drier, more stable atmosphere. See also other related papers on the topic by Phil Klotzbach and Bill Gray in 2008’s Journal of Climate and Shuo Li and colleagues in 2021’s Journal of Climate.
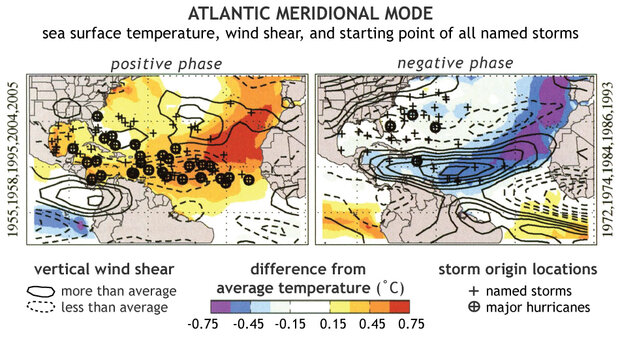
Comparison of ocean temperature patterns, wind shear, and hurricane activity during the positive phase of the Atlantic Meridional Mode (left) and the negative phase (right). The positive phase brings warmer than average surface temperatures in the tropical Atlantic (orange and red) and lower than average wind shear (dashed contour lines), favoring more named storms (start locations marked with plus signs) and major hurricanes (circled plus signs). The negative phase favors the opposite: cooler-than-average surface temperatures, higher than average wind shear (solid contour lines), and fewer storms. Figure adapted from Kossin and Vimont, 2007.
Causes of Atlantic Hurricane Multidecadal (50-80 Year) Swings
These multidecadal variations in Atlantic tropical storms and hurricanes are linked to a phenomenon, originally believed to be primarily natural in origin, called the Atlantic Multidecadal Variability (AMV)1 (see paper by Stan Goldenberg, Chris Landsea, and colleagues in 2001’s Science). NOAA climate scientist Rong Zhang led a recent comprehensive review (in 2019's Reviews of Geophysics) of the role of the Atlantic Ocean circulation2 on the AMV. The authors cited evidence that the Atlantic Ocean circulation is a crucial driver of the AMV, including multidecadal fluctuations in hurricanes and other phenomena in the Atlantic and surrounding regions. The following graphics from the Zhang et al. 2019 review paper show the observed AMV time series (top) and associated ocean temperature pattern (bottom). One can see a close similarity to the reconstructed hurricane time series above 3.
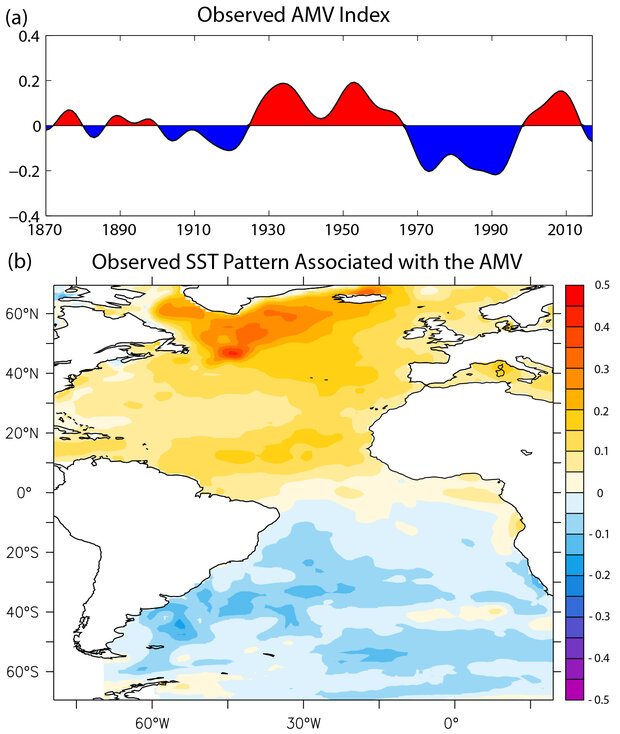
(top) Observed state of the Atlantic Multi-decadal Variability (AMV) Index from 1870 through 2017, with positive years colored red and negative years colored blue. (bottom) Difference from average sea surface temperatures in the Atlantic Ocean during the positive phase of the pattern, showing warmer-than-average temperatures north of the equator and cooler-than-average temperatures to the south. The temperature anomalies are reversed during the negative phase. Image from Zhang et al., 2019.
However, the underlying cause of the AMV remains somewhat controversial in climate science. There is disagreement among climate scientists regarding the relative contribution of man-made aerosol emissions 4, volcanic activity, and naturally occurring ocean circulation variability toward the observed AMV 5.
In terms of aerosols, the idea is that tiny, highly reflective particles in pollution—from vehicles, power plants, and industry—would have cooled the Atlantic and suppressed hurricane activity in the early to mid-20th century. As policies and laws to reduce air pollution took hold in Western Europe, Britain, and the United States in the 1970s, aerosol pollution declined, allowing Atlantic hurricane activity to rebound.
The Fifth Assessment Report from the Intergovernmental Panel on Climate Change concluded that there is medium confidence that reduced aerosol forcing (in other words, less aerosol pollution) contributed to the observed increase in Atlantic tropical cyclone activity since the 1970s, but the report does not estimate how big the influence might be.
In 2020, a colleague of Tom’s at GFDL, Hiro Murakami, and others used models to explore the causes of the observed global pattern of change in tropical storm frequency since 1980 (Fig. 4, top panel). Their models, which included man-made and natural influences, produce a fairly good representation of the global pattern of the observed trend.
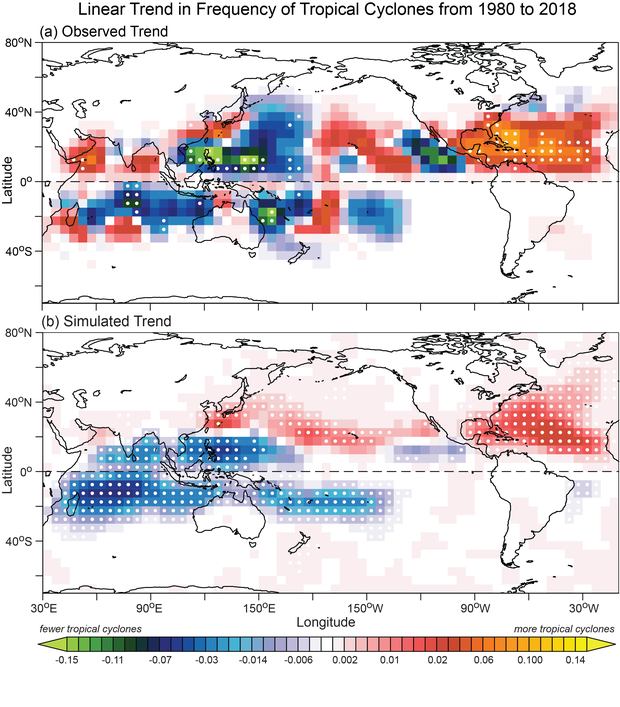
Trends in tropical cyclone activity between 1980-2018 according to observations (top) and models that include real-world trends in human-produced greenhouse gases and aerosols (bottom). Image from Murakami et al., 2020.
For the Atlantic basin, they concluded that external influences, particularly decreases in man-made aerosols and volcanic eruptions, likely played an important role in the increased tropical storm frequency since 1980. A similar finding for the Atlantic was reported by Dunstone et al. (2013) using a different model.
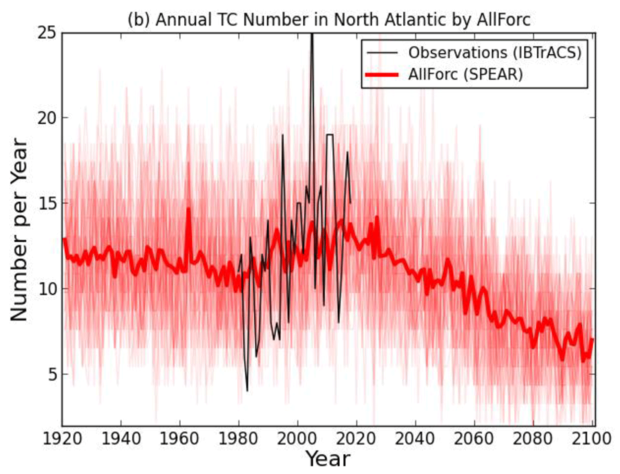
Comparison of observed (black) and modeled (red) Atlantic tropical cyclone frequency. The models, which included historical estimates of volcanic activity and human-produced greenhouse gases and aerosols, closely simulated the observed increase in activity from 1980-2020. Image from Murakami et al., 2020.
The graph above supports the hypothesis that the observed increase in Atlantic tropical cyclones from about 1980-2020 (black curve) resulted in part from the response to external influences (red curve). The temporary upswing in the red curve (model-simulated storms) during this period resulted from effects of decreasing aerosols. The aerosols had tended to suppress Atlantic tropical storm frequency in the model during the 20th century prior to the 1980s, but tropical cyclone frequency increased temporarily from about 1980 to 2020 in Murakami et al.’s model due to decreased aerosol emissions over North America and Europe. Meanwhile, both Murakami et al. and Dunstone et al. find that increasing greenhouse gases led to a decreasing tendency in Atlantic tropical storm frequency over the 20th century in their model, reinforced at times by the influence of increasing aerosols.
These studies are important contributions to the debate on this topic, but natural climate variability complicates confident detection of such aerosol-related influences. We need a better understanding of the relative contributions of natural variability, aerosols, and increasing greenhouse gases to the AMV and the increases in hurricane activity metrics since 1980.
The challenge of finding a human fingerprint
The importance of this distinction between potential causes of AMV for future hurricane projections is clear: if strong man-made aerosol forcing and volcanic forcing were responsible for most of the “quiet period” of Atlantic major hurricane activity from the 1970s through the early 1990s, then a return to this more “quiet” regime in the coming decades may not occur. But if the “quiet period” of the 1970s through early 1990s (as well as the earlier quiet period of the early 20th Century) was caused mainly by internal climate variability, one would expect to return to relatively “quiet” conditions in the coming decades as the climate swings back and forth between more active and inactive Atlantic hurricane periods. This is an important research question that does not yet have a clear answer.
Another important consequence of the observed AMV is its influence on detection and attribution of human influence on Atlantic hurricane activity. First, note that the hurricane reconstruction time series discussed above shows a clear increase from 1980 to 2015 or so, but the longer-term trend is relatively flat over the 20th century. Global surface temperatures and tropical Atlantic sea surface temperatures have increased since 1900 (by around +1.3 ˚C [+2.3 ˚F] and +1.0 ˚C [+1.8 ˚F], respectively), unlike the reconstructed hurricane counts or U.S. landfalling hurricanes. Finally, a number of studies have found that several Atlantic hurricane metrics, including hurricane maximum intensities, hurricane numbers, major hurricane numbers, and Accumulated Cyclone Energy have all increased since around 1980.
However, in a 2019 tropical cyclone-climate change assessment, the majority of authors concluded that the recent hurricane activity increases mentioned above did not qualify as a detectable man-made influences (meaning clearly distinguishable from natural variability). Another hurricane metric, the fraction of rapidly intensifying Atlantic hurricanes, was reported to have increased since around 1980 (Bhatia et al. 2019), and they found that this change was highly unusual compared with simulated natural variability from a climate model, while being consistent in sign with the expected change from human-caused forcing. Even so, however, their confidence was limited by uncertainty in how well the single climate model used was representing real-world natural variability in the Atlantic region.
For hurricane-related precipitation, the most recent report from the Intergovernmental Panel on Climate Change (IPCC AR6) concluded: “Event attribution studies and physical understanding indicate that human-induced climate change increases heavy precipitation associated with tropical cyclones (high confidence) but data limitations inhibit clear detection of past trends on the global scale.” Hurricane Harvey’s extreme multi-day rainfall totals were an interesting case for the Atlantic basin, with at least two studies (van Oldenborgh et al. 2017; Risser and Wehner 2017) concluding that in eastern Texas, observed rainfall extremes had increased due to human influence. However, a detectable human influence on hurricane-related rainfall in particular has not yet been confidently identified in observed long-term time series specifically of hurricane rainfall. Model calculations (e.g., Patricola and Wehner 2018; Reed et al. 2022) suggest that some human influence is probably present, even if not yet detected in long-term observations.
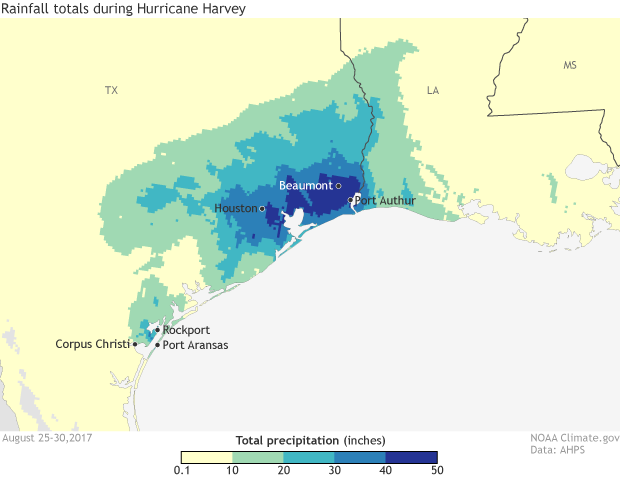
Rainfall estimates from NOAA's Advanced Hydrologic Prediction Service for August 25-30, 2017. Hurricane Harvey dropped over 20 inches of rain across a large area in coastal Texas, with some areas observing nearly 50 inches of rain. Studies concluded that global warming had contributed to the heavy rain. NOAA climate.gov image using data from NOAA's AHPS.
Why is it so difficult to detect man-made influence (especially greenhouse gas influence) on observed Atlantic hurricane activity metrics? This is partly because the reliable records for a number of metrics—especially basin-wide intensity-related metrics--are relatively short, with many only being available and reliable for trend analysis since about 1980. Further, trends over such short periods have been shown to be unrepresentative of longer-term trend behavior.
For the cases of metrics where we have longer relatively reliable records, strong multidecadal variability inhibits trend detection. In other words, the strong Atlantic Multidecadal Variability--whether it be due to internal climate variability or changes in aerosol or volcanic forcing--obscures and prevents a clear detection of a century-scale trend of the type one might expect due to greenhouse-gas warming. Meanwhile as mentioned above, the science is still unsettled on the relative contributions of changes in man-made aerosols versus natural variability on the recent upswing in hurricane activity in the Atlantic basin 6.
Therefore, in summary, we cannot yet say with confidence whether there is any detectable human influence on past Atlantic hurricane activity, and this is particularly the case for any greenhouse gas-induced changes. A temporary period of decreasing man-made aerosol emissions likely contributed, along with natural variability, to increased Atlantic hurricane activity since 1980, although its relative contribution remains uncertain.
Take-Aways
- Atlantic hurricanes display distinct busy and quiet periods: Busy hurricane decades occurred in the late 19th century, mid-20th century, and from the mid-1990s onward, but quieter decades in the early 20th century and in the 1970s to early-1990s.
- These multi-decadal variations in Atlantic tropical storms and hurricanes have been linked to a phenomenon called the Atlantic Multidecadal Variability, which may be primarily natural internal variability or aerosol-driven.
- A detectable greenhouse gas-induced influence on observed Atlantic tropical storm and hurricane behavior to date is difficult to identify because of the 50-80 year variability in hurricane activity.
- The bottom-line answer to the question in the title is: No, we cannot confidently detect a trend today in observed Atlantic hurricane activity due to man-made (greenhouse gas-driven) climate change. Some human influence may be present though still below the threshold for confident detection.
Footnotes
- This phenomenon was originally known as the Atlantic Multidecadal Oscillation. But it has more recently come to be referred to in the climate science community as Atlantic Multidecadal Variability (AMV), recognizing that it is not a pure oscillation.
- According to Zhang et al. (2019), the Atlantic Ocean Meridional Overturning Circulation (AMOC) includes the northward flow of warm relatively salty ocean water in the upper Atlantic and the southward flow of cold fresh (less-salty) North Atlantic Deep Water in the deep Atlantic. It is a major source of northward heat transport across the equator in the Atlantic, and is linked to the Atlantic Multidecadal Variability (AMV).
- Another study showing a direct comparison of Atlantic time series for the AMV, wind shear, major hurricanes, and ocean circulation is found in Yan, Zhang, and Knutson’s 2017 Nature Communications paper.
- As summarized in a NOAA State of the Science Fact Sheet on Atlantic Hurricanes and Climate: Human-caused sulfate air pollution tends to block incoming sunlight similarly to volcanic eruptions and mineral dust. Human-caused sulfate pollution over the Atlantic exhibits a pronounced variability over time. Prior to the various Clean Air Acts and amendments instituted by the United States and European countries in the 1970s, industrial sulfate emissions were much less regulated and air quality had become progressively worse. As the concentration of sulfate pollution over the Atlantic Ocean increased, the warming effects of increasing greenhouse gas concentration is believed to have been at least partially offset by the cooling effects of the pollution blocking incoming sunlight. Some studies suggest that decreases in sulfate pollution during and after the 1970s reduced aerosol cooling effects and allowed the North Atlantic Ocean to warm more quickly as greenhouse gas concentrations continued to increase. For more information, see the full fact sheet.
- For readers who want to learn more about this debate, here is a brief listing (with links) of related publications: Michael Mann and Kerry Emanuel in 2006’s EOS); Ben Booth and collaborators in 2012’s Nature; Nick Dunstone and colleagues in 2013’s Nature Geophysics; Amy Clement and collaborators in 2015’s Science; Rong Zhang and collaborators in 2013’s Journal of Atmospheric Sciences, 2016’s Science, and 2019's Reviews of Geophysics; Gabe Vecchi, Tom Delworth and Ben Booth’s overview in 2017’s Nature, Xiaoqing Yan and collaborators in 2018’s Geophysical Research Letters and 2019's Geophysical Research Letters; and Michael Mann and company in 2021’s Science).
- Note that we have discussed Atlantic changes here. Statements on detection or attribution of changes in tropical cyclone activity globally or in other basins are contained in the World Meteorological Organization tropical cyclone-climate change assessment and in Intergovernmental Panel on Climate Change 6th Assessment Report.
Comments
About comments
All comments are placed in moderation prior to publication, and this page is generally not moderated outside of business hours. Comments must be on-topic, free from personal attacks and profanity, and they cannot repeat climate disinformation.
Match with the AMO
https://www.climate.gov/media/14516 shows a remarkable match between it and https://climatedatablog.files.wordpress.com/2022/04/amo.jpeg which is the DETRENDED AMO data series, also with a 15 year low pass applied.
AMO matching
The AMV figure we show is from Zhang et al. (2019), Figure 2. From that paper the caption states: "Observed AMV index and SST pattern associated with AMV derived from the Hadley Centre Sea Ice and Sea Surface Temperature data set (HADISST) data set (Rayner et al., 2003). (a) Observed AMV index, defined as the 10-year low-pass-filtered area-weighted average of residual SST anomalies over the North Atlantic (80°W to 0°E, 0-65°N). The residual SST anomaly at each grid point is computed by removing the local component regressed on the global mean SST anomaly."
The data your figure points to is: psl.noaa.gov/data/correlation/amon.us.long.data
This is based on the Kaplan SST reconstruction. The figure we show has more ups and downs within the quasi-70-yr variations because it is using a 10-yr low-pass filtering as opposed to the 15-yr filtering applied in the Vecchi et al. major hurricanes figure or the 20-yr smoothing applied in your figure.
There are differences in the pre-1900 period (more of a peak in the hurricane reconstruction and the Kaplan-based AMO) but relatively small anomalies in the Zhang et al. AMV series. This is the time period where there is likely to be the most uncertainty in the SST and hurricane reconstruction estimates. For the 1900s onward the very low frequency behavior or all three series seems relatively consistent to me.
Match with the AMO
Further to this I can now compare the trended AMO (data from NOAA) with the UAH satellite series, both with a simple 12 month Gaussian low pass filer applied, and I find that there is a remarkable match over both the series since 1980
Trended AMO and UAH compared - Imgur
Response
Very interesting post. Thanks for putting it together.
Landsea and Knutson article re predicting human influence on hur
Please explain the sharp downward trend in North Atlantic TC number in years after about 2017 depicted in the plot produced from the SPEAR runs generated by what is indicated as AllForce.
Thank you.
Re: downward trend
Due to a bit of poor planning on my part, this post was published when the authors were not able to keep tabs and respond to comments. Bad editor!
However, they *will* respond sometime in the next couple weeks. Thanks for your question!
Explaining downward trend after 2017 in SPEAR
Thomas,
Although I'm not completely sure, we can note in the red (All Forcing) curve from SPEAR a general downward trend over the whole time period shown. This is to first order a response to greenhouse gas warming, which in the SPEAR model, produces a downward trend TC frequency over the Atlantic basin. The only exception to the downward trend is a temporary period of rising trend, from about 1980-2017, which coincides with a reduction in aerosol cooling in the model. So I think that what happens is the TC frequency rises for this brief period in response to the temporary reduction of aerosol-induced cooling. Once the reduction is basically "finished" (because you can only reduce it so far) then the greenhouse warming-induced reduction really takes over in the model. The behavior you mention around 2017 is at the transition point where the aerosol induced change (increase in TC frequency, due to reduced aerosol forcing) is replaced by the greenhouse gas-dominated reduction signal. Presumably in the pre-1980 period there was a gradual reduction in TC frequency over time due to the (weaker) greenhouse warming-induced reduction along with the gradual effect (also a TC frequency reduction) from the gradual build-up of aerosol loading and cooling in the pre-1970s period.
Detrended AMO (AMV)
Your AMO (AMV) image does not match NOAAs data.
amo.jpeg (1200×600) (wordpress.com)
This is NOAAs detrended AMO data with a 15 year low pass filter applied.
AMO detrended?
As I mention above, I had a bit of a scheduling mishap and managed to publish this post at a time when neither Tom or Chris was available to keep track of comments and respond. But have patience and they will get back to you in the next couple of weeks. Sorry for the inconvenience.
Detrended AMO (AMV)
The AMV index we reproduced in the blog is taken from the Zhang et al. (2019) review paper. You'd have to provide a link to a source describing in more detail the "NOAAs data" so that the two series could be compared in more detail. The image you show appears to have a smoother (lower-frequency) time smoothing applied. Also different authors sometimes use different definitions to construct the index and different SST data sets. In my initial comparison of the two images I don't see much of concern in terms of differences. One series seems to be much smoother than the other (different filtering?)
Add new comment