Beyond the Data Blog
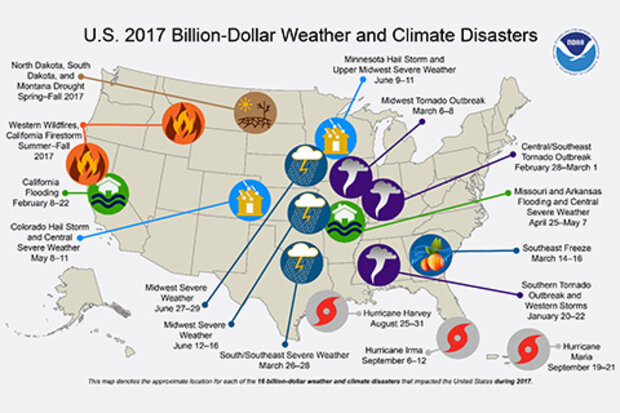
NOAA’s National Centers for Environmental Information (NCEI) tracks U.S. weather and climate events that have great economic and societal impacts (www.ncdc.noaa.gov/billions). Since 1980, the U.S. has sustained 219 weather and climate disasters where the overall damage costs reached or exceeded $1 billion (including adjustments based on the Consumer Price Index, as of December 2017). The cumulative costs for these 219 events exceed $1.5 trillion.
During 2017, the U.S. experienced a historic year of weather and climate disasters. In total, the U.S. was impacted by 16 separate billion-dollar disaster events including: three tropical cyclones, eight severe storms, two inland floods, a …
Read article
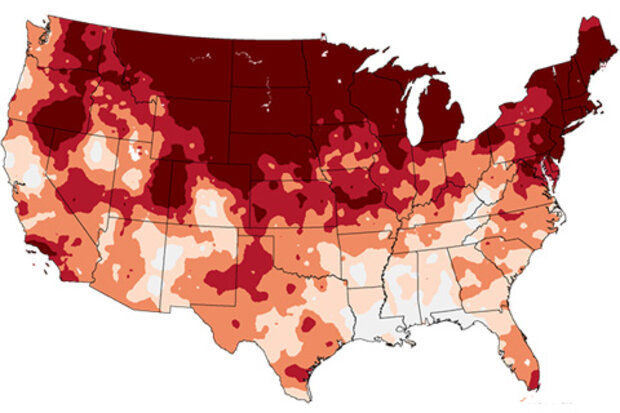
Our climate is changing and one of the most straightforward ways to understand these changes is by examining linear trends. In climate, to determine the linear trend we plot data values by when they occurred in the past and then determining a “best fit” line through that data. The slope of the line gives us the trend. Using this method we know that since 1895 the contiguous U.S. temperature has warmed at a rate of 1.45 °F per century.
However, temperatures are not warming uniformly in space or time. The cold parts of the day (nights), cold parts of the year (winter), and cold parts of the world (high latitudes) tend to be warming the fastest. To help our users understand how diff…
Read article
It was bound to happen. In fact, my colleagues have planned for this. More on that later.
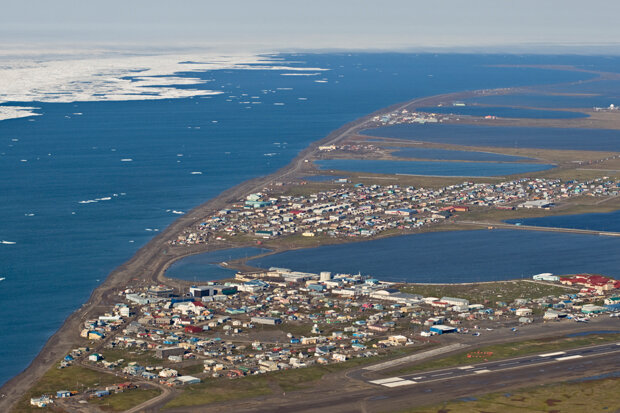
On December 4th, the folks in the Climate Monitoring group at the National Centers for Environmental Information (NCEI) did what we do pretty much every 4th of the month: we processed the previous month's data to prepare our initial US climate report. The data from Utqiaġvik, Alaska, was missing, which was odd. It was also missing for all of 2017 and the last few months of 2016. This was even weirder, because we knew we’d kinda marveled at how insanely warm the station had been for several weeks and months during 2017.
What happened?
The short version: in an ironic exclamation point to swift re…
Read article
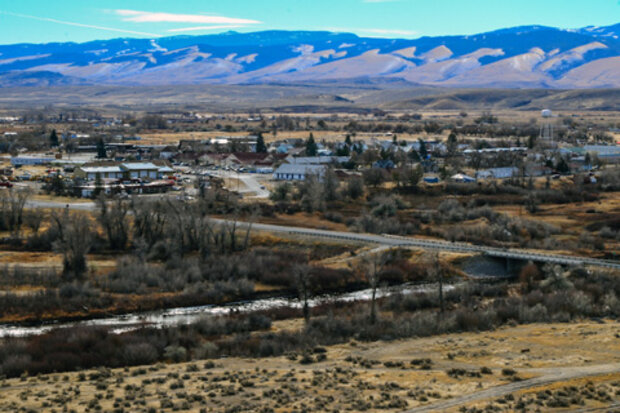
Hi! My name is Natalie Umphlett, and I am the interim director and regional climatologist at the High Plains Regional Climate Center (HPRCC). One of my favorite things about being a climatologist at the Center is helping people use climate data in meaningful ways. Most of the people we serve are not climatologists, so working one-on-one with them to understand their issues and then recommend a dataset or two that may help is an important aspect of my job.
One day I might be helping an agricultural producer to understand crop water use, while another I might be helping a medical doctor incorporate data into an asthma index. Because you never know who will be calling or writing into the Cen…
Read article
This year, especially this last quarter, has been a tough one on the weather and climate front.
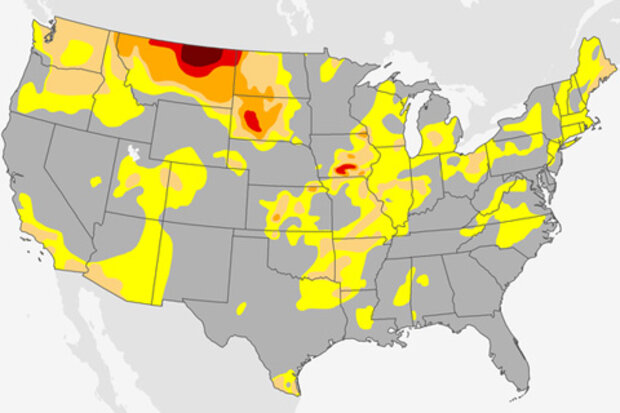
With that said, one silver lining of a rough 2017 has been the general retreat of drought on a national scale. This spring, according to the U.S. Drought Monitor, the fraction of the contiguous United States in drought dropped below 10 percent for the first time since 2010.
However, with that said, since then, a severe drought emerged quickly in the Northern Plains this summer. As droughts go, this was a “flash drought”—rapid-onset, regional drought, driven by combination of factors, typically during the summer.
The early impacts of this drought episode were covered here on Climat…
Read article
