Beyond the Data Blog
In keeping with the spirit of our blog, we’ll take a look at something obvious from the NCEI monthly climate analysis, then dig a little harder into some even more pertinent climatological truths.
1. March was warm - a lot warmer than you might think.
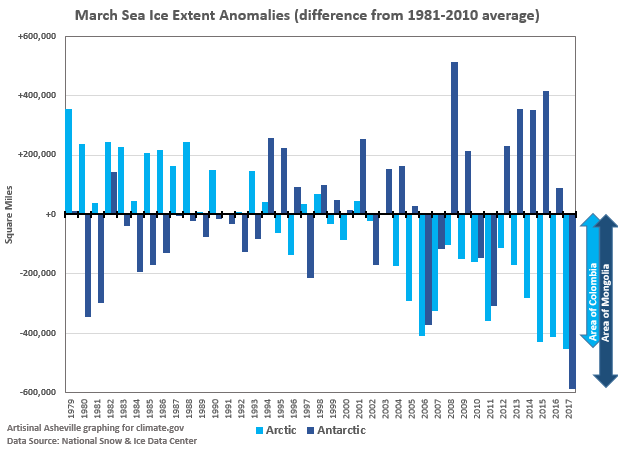
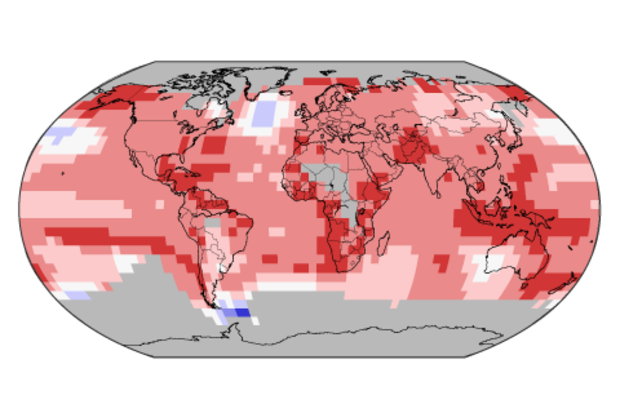
Our monthly State of the Climate report found that March 2017 was the second-warmest March on record for the globe. Just about any way you slice it, it was second only to 2016 in the history of global-scale temperatures for March. But, as we’ve pointed out in this space before, sometimes it’s human nature - or perhaps American nature - to interpret “second warmest” as “not all that warm.”
But it’s worth a closer look, in two dime…
Read article
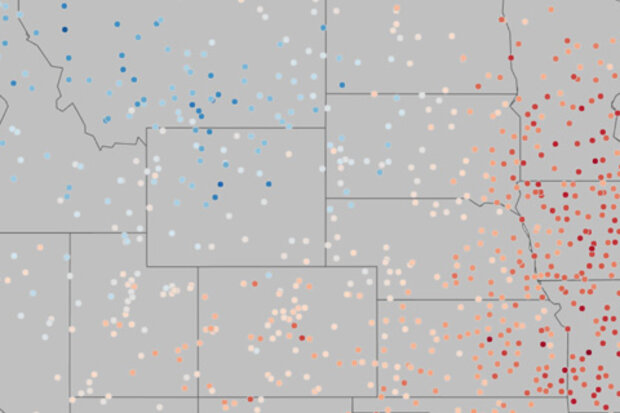
Recently, the National Centers for Environmental Information (NCEI) identified February 2017 as the second-warmest February on record for the contiguous United States (CONUS). According to NCEI’s report, the CONUS average temperature for the month of February was 41.2°F. Compared to the twentieth-century average (1901-2000), the CONUS was 7.3°F warmer than average, indicating February 2017 was an abnormally warm month.
The same can be said for January 2017, with a CONUS average temperature of 33.6°F, which is 3.5°F above average. The warmer than average temperatures so far this year have already led to an early blooming period in the southern and eastern parts of the United States.
…
Read article
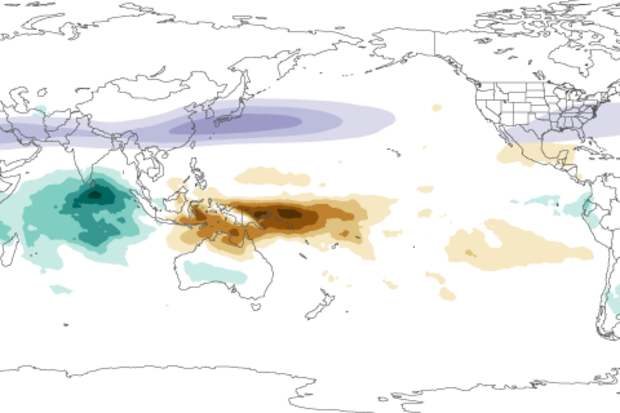
The United States has experienced some intense weather patterns lately, including flooding in California and a Nor’easter in New England. We can’t trace these back to a butterfly flapping its wings on the other side of the world, but we can connect them to tropical rainfall patterns that seem just as far away.
The tropical Pacific and Indian Oceans have some of the warmest oceans temperatures in the world. They provide plenty of heat and humidity for heavy rain and thunderstorms — storms that are so strong they can change global wind patterns and affect weather around the globe. El Niño and La Niña are the best-known examples of how shifts in those rainfall patterns can have global effect…
Read article
Just a few days ago, on January 26th, 2017, we saw something in the U.S. climate that we hadn’t seen since March 2011. Well, technically, we didn’t see something, I guess.
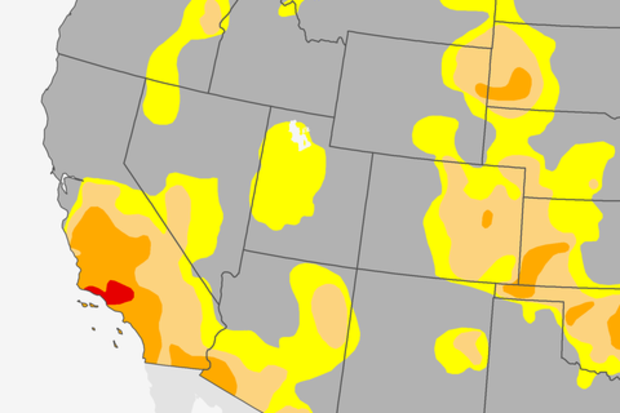
For the first time since March 2011, there was no D4, “exceptional drought,” anywhere in the United States, as analyzed by the U.S. Drought Monitor. The last vestige of D4—the most severe category in the monitoring system—disappeared from its southern California holdout, part of a larger pattern of substantial mid-January drought improvements in California.
(note: it is always difficult to describe drought improvements as “improvements” knowing they came, as they often do, with the price tag of major flooding and…
Read article
Looking back on Earth’s global temperature over the past three years...2014: record warm—wow! 2015: record warm—wow!! 2016: record warm—holy cow!!!
In 2016, the annual global temperature reached a record high for the third year in a row, a remarkable occurrence rarely seen in the 137-year NOAA record and one not seen since the streak of record warmth (at the time) of 1939, 1940, and 1941.
Those years, which ranked as third warmest, second warmest, and warmest, respectively, in 1941, now rank as 64th, 50th, and 38th warmest today. But back to the current streak…how did this happen?
If you guess long-term climate change—Yes! If you guess El Niño—Yes! Also correct. If you guess sup…
Read article
