April 2020 ENSO Update: Alternative Communication
It’s a new month, but it seems like an entirely different world as we peer at the tropical Pacific Ocean. Sea surface temperatures remained warmer than average, but the tropical atmosphere shifted away from its El Niño-ish appearance during February. The lack of coupling between the ocean and atmosphere leads forecasters to once again favor the continuation of ENSO-neutral with a ~60% chance during the summer, and remaining most likely during the autumn.
Share Your Screen
In the last month, ocean surface temperatures in the Niño-3.4 region have been bubbling around +0.5°C, our El Niño threshold. If you look at monthly averages in this region going back to October 2019, we’ve been between +0.45°C and +0.50°C for five of the six months! That’s pretty special!
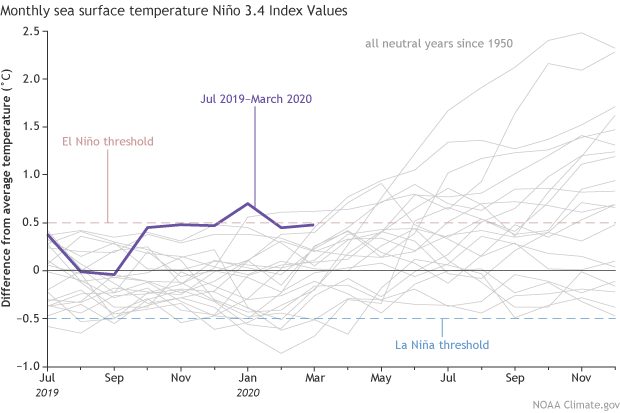
Monthly sea surface temperature in the Niño 3.4 region of the tropical Pacific for 2019-2020 (purple line) and all other years starting from neutral winters since 1950. Climate.gov graph based on ERSSTv5 temperature data from NCEI.
It’s special because there isn’t an analogous streak, remaining right at +0.50°C, in the historical record going back to 1950. However, keep in mind that right now the “departure from average” is being computed relative to 1986-2015 seasonal averages. Eventually, because we roll the climatology forward in time, the current numbers will change when we update the reference (averaging) period to 1991-2020. Because sea surface temperatures are above average over most of the Tropics right now, suggesting that the updated 30-year average will be warmer than the 1986-2015 average, we are betting these historical index values will eventually be revised downwards.
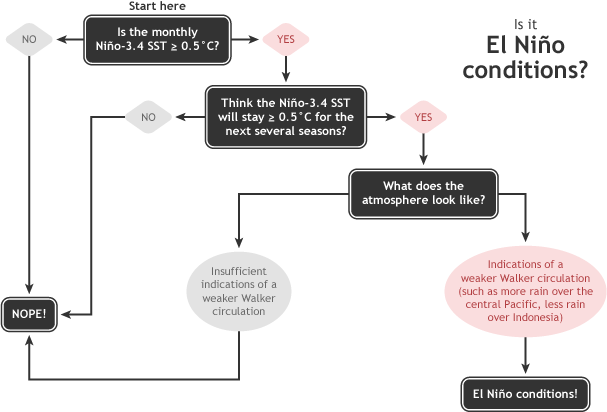
However, we don’t just look at the ocean temperatures when we determine the status of ENSO—we also examine the atmospheric circulation over the tropical Pacific Ocean. Changes in the atmospheric circulation (especially the location of tropical rainfall) result in teleconnections that impact the climate over far-flung regions across the globe.
Other than some evidence in February, we have not seen persistent shifts in tropical rainfall, and March 2020 was no exception. In the past month, rainfall/cloudiness was near average-to-suppressed in the central tropical Pacific Ocean (during El Niño, there is typically increased rainfall/cloudiness in this region).
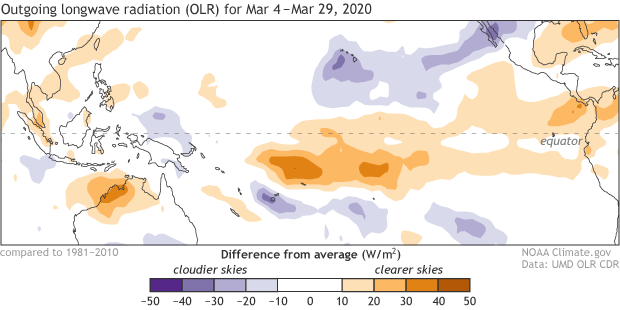
Places that were more (purple) or less (orange) cloudy than the 1981-2010 average during March 2020, based on satellite observations of OLR (outgoing longwave radiation, or heat). Thick clouds block heat from radiating out to space, so less radiation equals more clouds and rainfall, and more radiation equals clearer skies. The lack of clouds and rain resulting from the cooler-than-average side of the IOD can be seen on the left of this map. Climate.gov map from CPC data.
Stronger-than-average trade winds were also observed over the central and eastern tropical Pacific Ocean, which is not typical of a reduced Walker circulation that would occur during El Nino. The Southern Oscillation indices remain near average as well. So, it appears the warm ocean is socially distant from its atmospheric dance partner.
Mute Your Audio
Model forecasts continue to indicate that ENSO-neutral conditions will persist through Northern Hemisphere summer and into the autumn of 2020. Forecasters are keeping one eye on a possible La Niña during the latter half of the year, which is reflected in the 30-40% chances. The “in house” NCEP Climate Forecast System (CFSv2) is one of the most bullish models to support development of La Niña, but there are many other state-of-the-art models that disagree, so forecasters are not putting much weight in it at this point.
With that said, the spread of possible outcomes is still considerable and we are smack dab in the midst of the spring prediction barrier, which is when models tend to have lower skill or accuracy.
Also, as Emily pointed out last month, it would be unusual for a La Niña to form after an ENSO-neutral winter. But as regular readers know, with only a small number of historical ENSO events to compare to (20-25 El Niño or La Niña episodes since 1950), “unusual” is often the norm! All the more reason to keep watching ENSO—each event or non-event is a learning experience.
That’s the Way We Became the Brady Bunch
We’re on the cusp of our 6th birthday on the blog, so by now you may be wondering who are the people who bring you these ENSO predictions every month. Our newly remote set up provided an opportunity for a group photo among the team… brains and brawn power these ENSO forecasts!
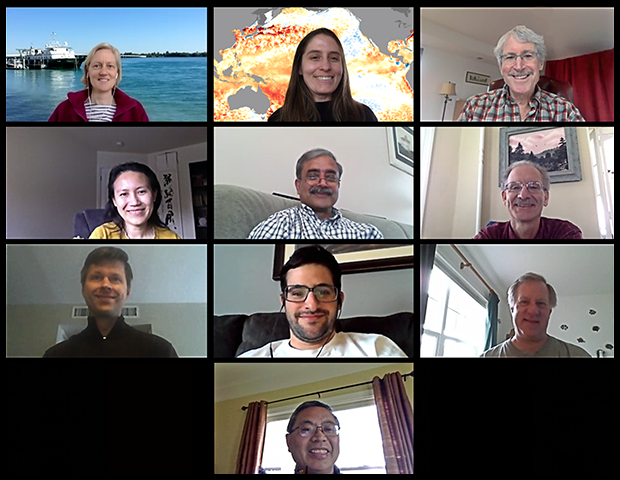
The ENSO forecast team. From left to right, starting in the top left: Emily Becker, Michelle L’Heureux, Tony Barnston, Caihong Wen, Arun Kumar, Mike Halpert, Nat Johnson, Tom Di Liberto, Gerry Bell, Zeng-Zhen Hu, and Wanqiu Wang (not pictured). Emily and Michelle are distancing at home as well, but posing in front of “virtual backgrounds.”
It is a privilege to work with such a talented bunch of scientists and communicators. Even in these uncertain times we’ll continue to look ahead for you. I’m swapping with Emily (top left square) this month, so look for her blog post later this month and again early next month. Until then, stay safe and physically distant!
Comments
Thank you!
ENSO ocean-atmosphere socially distant
Compliment
April 2020 ENSO update
RE: April 2020 ENSO update
Thanks for your support, Jeff!
El Nino
RE: El Nino
The rolling base period for the current departures will update next year, likely during January. This will certainly impact the recent values, but it's too soon to speculate how. You are correct in the if the FMA2020 ONI comes it at 0.5 (or greater) that will satisfy one of the criteria for an El Nino. However, El Nino is a coupled Ocean-Atmosphere phenomenon, and the ONI is just one indicator as we note at the top of the ONI index page (link: https://origin.cpc.ncep.noaa.gov/products/analysis_monitoring/ensostuff/ONI_v5.php ). We've seen instances in the past, where the numbers in the table are red, yet El Nino was not judged to have developed (see late 2014 for one recent case where we did not declare El Nino), as there was not the expected atmospheric response until February 2015. For more detail on the criteria for determining El Nino see Emily's outstanding blog post (and flow chart) from January 2016.:
https://www.climate.gov/news-features/understanding-climate/el-niño-and…
El niño
RE: El niño
We do not consider 2019-20 to be an El Nino because we consider many different indices and datasets. ENSO is a coupled ocean-atmosphere phenomenon. The ONI is one index, or one measure, and it is not the only one. In this case, as we explained in our blog post above, it’s likely that temperature trends that are influencing recent values and we will likely see a revision in January 2021 when the 30-year climatology is updated to 1991-2020 (right now we’re using 1986-2015).
Keep in mind that ONI values over the past decade will continue to change as the rolling climatology moves forward. The ONI is a retrospective index, meaning it’s primary use is for historical comparisons and composites going back to 1950. But ONI values near our threshold (-/+0.5C) are marginal and may not be sufficient to achieve declaration (we did not consider late 2014 an El Nino either). In sum, we do not rely on the ONI, by itself, for real time monitoring and our Advisory system is explained here, which uses multiple datasets and indices.
Add new comment