April 2022 La Niña update: measuring up
La Niña continues in the tropical Pacific, with both the ocean and atmosphere clearly reflecting La Niña conditions. The current forecast favors the continuation of La Niña through the summer (59% chance), with a slightly lower chance into the fall (50-55% chance). A third-year La Niña would be pretty unusual—we’ve only seen two others since 1950. I’ll run the numbers to see how current conditions add up and what’s factoring into the odds for La Niña later this year.
Paint by numbers
Let’s take stock of current ENSO conditions (ENSO=El Niño/Southern Oscillation, the whole ocean-atmosphere El Niño/La Niña system) in the tropical Pacific. In March, the sea surface temperature in the key ENSO monitoring region (Niño-3.4) was still well within the La Niña range, about 1.0 °C cooler than the long-term (1991-2020) average, based our most reliable historical record, ERSSTv5. Remember: the La Niña threshold is a temperature anomaly—a difference from the long-term average—in the Niño-3.4 region of -0.5 °C or lower. March 2022 was the 6th most negative March sea surface temperature anomaly in Niño-3.4 since 1950.
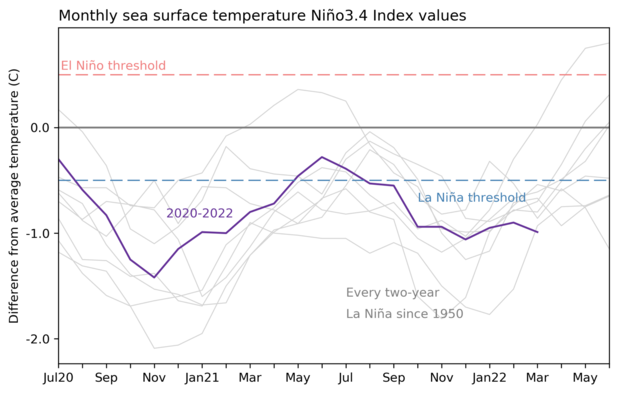
Monthly sea surface temperature anomalies (difference from average) in the Niño 3.4 region of the tropical Pacific for 2020–22 (purple line) and all other multi-year La Niñas (gray lines) starting since 1950. Climate.gov graph based on ERSSTv5 temperature data.
As you can see from the graph, March 2022 was also tied for the coldest of the nine second-year La Niña events on record, for this time of year.
One plus one
While the ocean surface temperature confidently indicates that La Niña is still going strong, it’s not unusual for this time of year, and wouldn’t necessarily tell us much about how long this La Niña might last. Things start to get interesting when we look at the atmosphere, though, providing a bit more insight into why forecasters are favoring La Niña to continue through the summer.
ENSO Blog frequent flyers will know that ENSO is a coupled ocean-atmosphere system. Changes in the tropical Pacific Ocean temperature influence the circulation of the atmosphere (the Walker circulation); those atmospheric changes in turn affect the ocean temperature, and so on. For example, La Niña features cooler-than-average surface water in the central and eastern equatorial Pacific and warmer-than-average surface water in the far western Pacific. This cool-versus-warm pattern leads to less rising air and storms over the central Pacific and more over Indonesia, amping up the normal Walker circulation and driving stronger near-surface winds along the equator—the trade winds. Stronger trade winds further cool the surface and keep even more warm water piled up in the far western Pacific, reinforcing La Niña… you see where I’m going! For more details, visit Michelle’s post on the mechanics of ENSO.
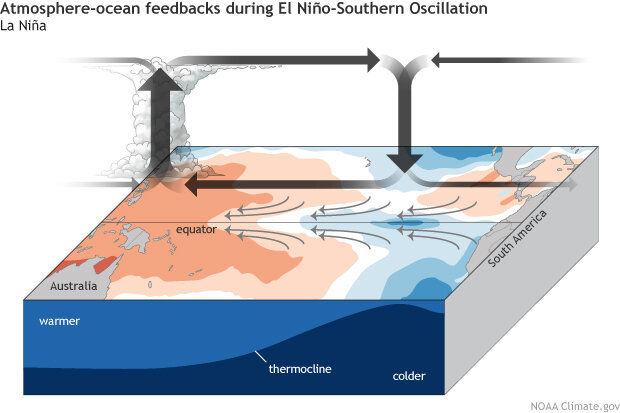
During La Niña, the surface trade winds (small gray arrows) blow more strongly than normal, piling up warm surface water in the western Pacific and drawing up deep, cool water in the eastern Pacific. Over the warm waters, the air becomes more buoyant (upward thick arrow), and rainfall increases. Over the cool waters, it is less buoyant, favoring subsidence (downward gray arrow) and less rainfall. These feedbacks between ocean and atmosphere strengthen the La Niña event. Climate.gov schematic by Emily Eng and inspired by NOAA PMEL.
Baby, don’t lose my number
Enough preamble—what’s the Walker circulation doing right now? I thought you’d never ask. It’s really feeling its oats these days, as several different atmospheric measurements tell us.
First, let’s talk Equatorial Southern Oscillation, an index that measures the relative sea level pressure in the far western Pacific vs. that in the eastern Pacific. When the EQSOI is positive, it indicates lower-than-average pressure over the west (more rain and clouds) and higher-than-average pressure over the east (less rain and clouds), i.e., evidence of a stronger Walker circulation. In March, the EQSOI measured 1.4, the 6th strongest since 1950.
As I mentioned above, stronger trade winds are key to the La Niña feedback between the ocean and atmosphere. The trade winds were enhanced through March, and remain stronger than average into mid-April. You want a number, you say? Okay! There’s an index that measures the near-surface winds in the central Pacific region of 5°N–5°S, 175°W–140°W; it was 4.3 meters per second (9.6 miles per hour) faster than average in March. This is the strongest March value on record, but there’s a catch—this record only goes back to 1979.
One more index! The central Pacific was much less cloudy and rainy than average in March. We monitor cloudiness via satellite, by looking at how much radiation is leaving the Earth’s surface and reaching the satellites. Less radiation making it to the satellite means more clouds are blocking the path.
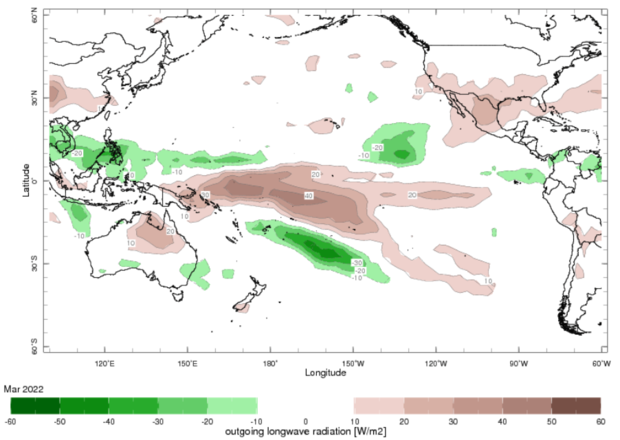
March 2022 outgoing longwave radiation compared to 1991–2020 average. Brown regions show where satellites received more radiation from the Earth’s surface, indicating fewer clouds and drier conditions. Green shows regions with more clouds. Figure from the International Research Institute for Climate and Society’s maproom.
The index that measures outgoing radiation (and therefore cloudiness), the CPOLR, tells us that this March featured the least amount of clouds for any March on record over the central Pacific. We’re number 1! Again, though, like the winds, this record only goes back to 1979, when the satellite measurement era began. So, a grain of salt with your records.
One last measurement today—let’s look under the surface of the tropical Pacific Ocean. The amount of cooler-than-average water under the surface increased in March. This cooler subsurface water provides a supply of cooler water to the surface, contributing to ENSO forecasters’ prediction that La Niña will remain into the summer. Index-wise, last month the water under the surface was the 9th coolest March since 1979.
Water temperatures in the top 700 meters (2,300 feet) of the tropical Pacific Ocean compared to the 1991–2020 average in early spring 2022. NOAA Climate.gov animation, based on data from NOAA's Climate Prediction Center.
Add it all up
There are two main information sources for ENSO forecasters: current atmosphere-ocean conditions and computer model predictions. Computer models have a harder time making successful long-range predictions in April, during the spring predictability barrier, although they remain a critical tool. Current model predictions are mostly split between staying in La Niña or transitioning to neutral in summer. Looking out to next fall, the North American Multi-Model Ensemble is leaning toward La Niña conditions.
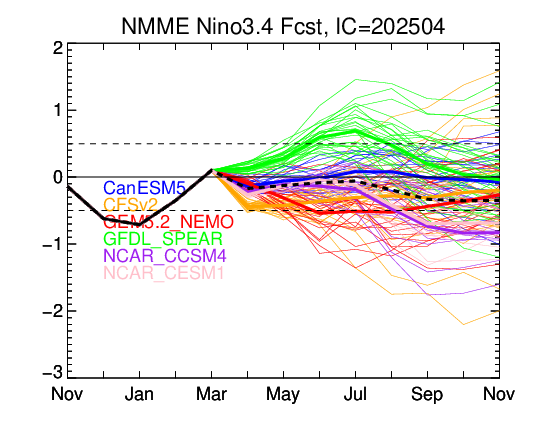
There is a lot of uncertainty in the current forecast, which is reflected in the probabilities. The odds for La Niña to remain through the next few months are fairly confident, bolstered by the cooler subsurface water and the current strong Walker circulation. The chance of a third-year La Niña has a slight edge for the fall, over the chance of neutral conditions. El Niño is unlikely—less than 10% chance. None of the models are predicting El Niño for the fall, and none of those March atmospheric conditions I described earlier have been followed by El Niño later in the year. It’s not impossible—nature is full of surprises—but very unlikely.
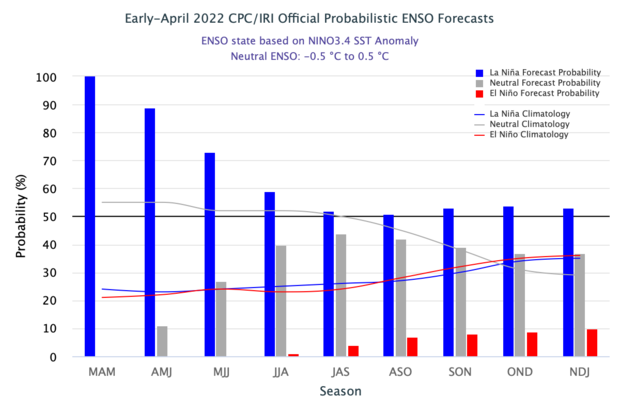
The official CPC/IRI ENSO probability forecast. The bars show the seasonal chances for each possible ENSO state—El Niño (red), La Niña (blue), and neutral (gray)—from spring 2022 through winter 2022–23. The forecast is based on a consensus of CPC and IRI forecasters, and it is updated during the first half of the month, in association with the official CPC/IRI ENSO Diagnostic Discussion. It is based on observational and predictive information from early in the month and from the previous month. Image from IRI.
La Niña influences the hurricane season (more storms in the Atlantic, fewer in the eastern Pacific), has links to springtime tornado activity (complicated links!), and can increase the chance of drought in some regions. Given all these important relationships, we will closely watch the forecast and look forward to starting to emerge from the spring predictability barrier in the months ahead.
Comments
About comments
Update to chart
Have you considered updating ENSO-Blog_ERSSTv_20220411.png | NOAA Climate.gov to include this month, April.
RE: Update to chart
Since the temp data are monthly average, we won't be able to update that chart until sometimes in May (takes time to process/QA each month's data). There are places where you can see weekly temperatures (check this page), but remember...
Keep calm and stop obsessing over weekly changes in ENSO
;-)
Update to chart
Well CFSv2 includes April data now
nino34Mon.gif (1100×850) (noaa.gov)
RE: Update to chart
Yes, but as you can see, the black line showing the temperatures of the current La Niña event becomes dashed at the beginning of April, meaning it is a forecast for April. Our plot is the monthly average observations, so they won't be available for a few weeks yet.
Update to chart
There is a difference between 1st Mar (which your chart shows) and 1st April (which NOAA shows) but, eventually you will have to update your chart to include that (and 1st May later on as you say).
Update to chart
I should clarify that I mean 1st Feb, 1st March and 1st April. But I will have to wait until you get round to being up to date.
Summertime ENSO Impacts
Is there a known or stereotypical pattern setup in the summer for La Nina over the CONUS, similar to what we know about the wintertime pattern? Is it similar to the winter but slightly muted? If La Nina continues, what can that do for our long term summer forecasting?
Summer influences on the…
Summer influences on the United States from ENSO aren't nearly as strong or consistent as those during the winter, which is why they aren't generally used as much. A lot of this is due to how ENSO affects US weather through influencing the jet stream. During the summer, the jet has moved poleward and isn't as important.
Triple Laninas
Hi Emily and Thank you for the updates .
I have asked this very question several times since December 2021 about whether a triple lanina is likely in 2022/2023 winter -if you can retrieve my comments from previous forecasts -I have them in record anyways .
The most recent ( triple laninas in a stretch ) event according to your previous forecasts was between 1971-1976 there were three laninas separated by one strong elnino during that span of time .
A pressing question comes up : what are the odds that we get moderate/strong laninas if a third lanina would occur next winter , it makes sense to my region because we have droughts since several decades . and kindly when was the other three lanina stretch before 1970 , which years in particular if you may kindly help . I am interested in the time-span between these evens although i believe we may have other three-dipped laninas before 1910 back to 1850 according to reconstructed thermal data . These consecutive lanina events may have some explanations , i am constantly wondering what may manifests them and truly interested in them from statistical point of view -as a statistician .
Thank you so so much and apology for the long message .
Warmest Jordanian Regards
Mohammad Alkhateeb
Hi Mohammad, That is an…
Hi Mohammad,
That is an excellent question that I just don't have a great answer for. Strength forecasts this far in advance are difficult. And given just how rare it is for a third consecutive winter to have a La Nina, we just don't have a lot of historical context to go back on.
Once we get through the spring predictability barrier and into the northern hemisphere summer, I imagine we'll start feeling more confident to start discussing strength levels if the forecast continues to favor a la nina during the upcoming winter.
Thank you
Thank you Emily for your reply . do we have a record of the triple-dipped laninas before 1970 back to 1850 ? i would appreciate it if you kindly share a link to their archieve , I am trying to get better understanding of them via subjecting them to geometrical time-until-next event analysis if i had a long window of data like 1850-2022 to see if any story unveils from them . I will be happy to share the results with you if you may would like them in the near future
Thanks a cloud of thank You's
Warm regards
Mohammad
The record that NOAA uses…
The record that NOAA uses goes back to 1950, because that is the period that we have high confidence in the quality of the ocean observations. It looks like you can access a longer timeseries here, made from the HADISST reanalysis data. I don't know much about this data series, so I can't share any advice about it. Have fun!
Thank you
Thank you so much .
BR
Mohamed
La Niña probability update
To say this latest update to the data set is 'merely fascinating' would be a gross understatement. It looks that the probability of El Niño conditions markedly declined the last 6 months, and now the potential of a third(!) year of La Niña is absolutely incredible. Indeed, this is an astounding development for all climate science research.
Looking forward to any new findings on how the drivers of the ENSO system function. Maybe atmospheric influences at the various layers, are much more important than is widely assumed?
Thanks for the excellent work.
graph quality
"As you can see from the graph, March 2022 was also tied for the coldest of the nine second-year La Niña events on record, for this time of year."
Important observation but the graph is not able to be seen i.e. you can see the 2022 line but the other la Ninas are too faint to see.
There was a graph last long where one could see all two year La Ninas
I realize that it is tough to get good resolution on that kind of graphic. But it is an important observation so it might be worth the effort to improve it.
Re: graph quality
Thanks for the feedback. Finding the right shade/transparency for the "all other events" lines can be tricky, especially when you have all the permutations of monitors/browsers/operating systems, which can cause the appearance to vary.
Are you saying the lines are so faint on your screen that you can't tell for sure whether there are some gray lines below the 2022 purple line?
Number of Triple Dip La Ninas
When trying to quantify the # of triple dip La Nina events since 1950 using the CPC ONI Table, one comes up with 2 previous events using the cold season only (i.e. Nov thru March). 1973-1975 and 1998-2000. However, what about 1954-1956? "Triple dip" status was clearly achieved in the April thru October time frame, but not during the cold season. Is this the reason why this potential "triple dip" is not included in your excellent blog?
https://origin.cpc.ncep.noaa.gov/products/analysis_monitoring/ensostuff…
Good point, Victor! That…
Good point, Victor! That event was an unusual one, for sure. We don't include it as a three-year La Niña because (as you said) there are only two boreal winters that qualify. ENSO peaks in the winter, and global impacts are strongest in the winter. Looking closely at that 1954-56 stretch, though, I must say I'm glad I didn't have to make forecasts (or write blogs!) during that one. Negative anomalies lingered through the winter of 56-57, but they weren't strong enough to qualify as La Niña and the tropical Pacific returned to neutral conditions. This is the second most likely scenario for winter 22-23, as illustrated by the bar chart above.
Equator
Well if the 2022-23 La Nina third year row, like we did in 2000-2001.
We'll see about El Nino will be Very Strong, in 2024-25, or Weak El Nino of 2026-27 maybe for dry in California, then 2028-29 Moderate El Nino.
La Nina is again for 2029-30, will be Weak one.
Arriaga
The event El Niño 2022 - 2023?
New Mexico 2022 Monsoon odds
Given that we are probably looking at a three-year La Nina, should New Mexico be prepared for a greatly diminished 2022 summer monsoon season? (NOAA is predicting a normal to above normal monsoon for parts of Arizona.) Do we in New Mexico have any hope for one as well? Or is it too early to tell due to the spring predictability barrier? Our state is currently burning up, having the worst fires in the country. And, could there potentially now be more than three back-to-back La Ninas, due to accelerating climate change? Thank you for your input.
There's really not much of a…
There's really not much of a link between La Nina and the monsoon in the southwestern US, so a continuation of La Nina likely won't impact the upcoming rainy season. The relationship between La Nina and precipitation in the Southwest is much stronger during the winter, so a 3rd winter of La Nina would not bode well for a rainy winter, at least in New Mexico. There's no clear link between La Nina and climate change at this time.
meierhoff
Every single year they attribute the weather to El Nino or La Nina. Every single year.
attribution
I am not sure whom "they" refers to here, but at the ENSO Blog I think we're pretty consistent in saying that El Nino or La Nina can tilt the odds toward certain types of weather in certain locations.
Add new comment