August 2024 Outlook: A La Niña Watch in the dog days of summer
You’ll have to excuse this ENSO Blogger for a minute while I drink some sweet tea on the porch and lament about all the heat and humidity, “Woof, it’s hot!” Things truly seem to move slower during the dog days of summer in late July and early August. And it seems like the El Niño/Southern Oscillation (ENSO), a climate pattern in the tropical Pacific Ocean that can affect weather across the world, is no exception. The expected transition from ENSO-Neutral to La Niña continues to proceed slowly, as if the whole Pacific is stuck in a summer daze, moving as slow as molasses.
According to the August ENSO outlook, ENSO-Neutral conditions remain across the Pacific, with La Niña favored to develop during Autumn (66% chance) before persisting through the Northern Hemisphere winter (74% chance during November-January).
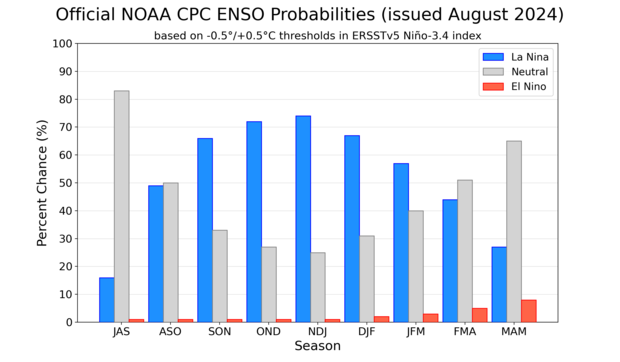
Out of the three climate possibilities—La Niña, El Niño, and neutral—forecasts say that neutral conditions are the most likely for the July-September season (tall gray bar above the JAS label, over 80 percent chance). By the September-November (SON) season, La Niña has the highest chance of occurring (blue bar, above 65 percent chance). NOAA Climate Prediction Center image.
Can I get a fan, please?
All that summer heat can make one forgetful so let’s go back over why we care so much about ENSO. First, a reminder that El Niño and La Niña are opposite phases of ENSO. El Niño occurs when the water in the eastern and central tropical Pacific is warmer than average, while La Niña occurs when the water is cooler than average. That change in water temperature can jumble up the tropical atmosphere above it, causing a global cascade of atmospheric impacts. The end result is shifts in the jet stream and changes in weather patterns, often leading to wild weather including floods, droughts, and heatwaves.
But unlike other climate phenomena which can be difficult to predict even two weeks prior, the phase of ENSO can be predicted many months in advance, giving communities worldwide vital time to prepare.
ENSO-Neutral, meanwhile, simply reflects that ocean temperatures are near-average, with little unusual impacts on the atmosphere above it.
Toes in the water
The last month has seen near-average sea surface temperatures across most of the equatorial Pacific Ocean, so we are squarely ENSO-Neutral. The Niño-3.4 region of the Pacific, which is our primary monitoring region for ENSO, was 0.1°C warmer than the long-term average from 1991-2020, according to ERSSTv5, our most reliable sea surface temperature dataset. Yep, I did say “warmer.” So let’s dive deeper into the Pacific for the reason we are still forecasting the development of La Niña (eventually) this year.
While sea surface temperatures are currently perfectly cromulent, below-average water temperatures in the subsurface (the surface to 300 meters below the surface) of the tropical Pacific Ocean strengthened in the past month, expanding across more of the central and eastern Pacific Ocean. These cooler-than-average waters will be one of the driving forces behind any La Niña that forms later this year.
Beneath the surface of the tropical Pacific Ocean at the equator, a deep pool of cooler-than-average (blue) waters has been building up throughout the summer to date (June 7-August 1, 2024). This pool of relatively cool water is a key factor behind the prediction for La Niña later this fall and winter. NOAA Climate.gov image, based on analysis from Michelle L'Heureux, Climate Prediction Center.
Meanwhile, for as interesting as the ocean has been, the atmosphere has been the opposite. The trade winds were slightly more easterly than normal in July (which reflects slightly stronger-than-average trade winds), while thunderstorm activity was generally near-average. A pretty clear reflection of ENSO-Neutral.
Whew! When is that cold front coming?
Let’s talk about the forecast. So far this summer, the climate models we use for guidance have been trending toward a weaker and delayed development of La Niña than they first hinted in the spring. In May and June, the models forecasted a start during summer. But the most recent forecasts pinpoint early fall as the most likely start time. Regardless, the overall model consensus remains that La Niña will likely form this year and last through the upcoming winter.
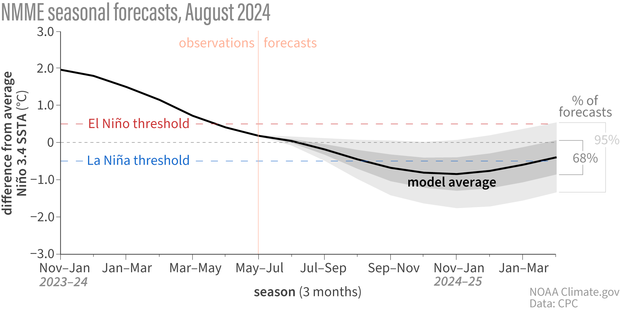
Line graph showing observed and predicted temperatures (black line) in the key ENSO-monitoring region of the tropical Pacific from winter 2023-24 though winter 2024-25. The gray shading shows the range temperatures predicted by individual models that are part of the North American Multi Model Ensemble (NMME, for short). Most of the shading appears below the dashed blue line by the fall, meaning most models predict that temperature in the Niño-3.4 region of the tropical Pacific will be cooler than average by at least 0.5 degrees Celsius (0.9 degrees Fahrenheit)—the La Niña threshold. NOAA Climate.gov image, based on data provided by Climate Prediction Center.
This fact, combined with current observations of cooler-than-average water at depth across the Pacific and slightly enhanced trade winds, give forecasters confidence that even though the transition to La Niña has been slower than initially expected, it’s still likely to form later this year.
Can someone just turn the AC on?
The burning-hot, must-be-suffering-from-heat-exhaustion-at-this-point elephant in the room continues to be the hot streak Earth has been going through for more than a year (as well as the longer warming trend associated with human-caused climate change). Global ocean temperatures have been record breaking every month for well over a year. And just as we noted some uncertainty on how this would affect the 2023-24 El Niño (RIP), the same goes for any developing La Niña.
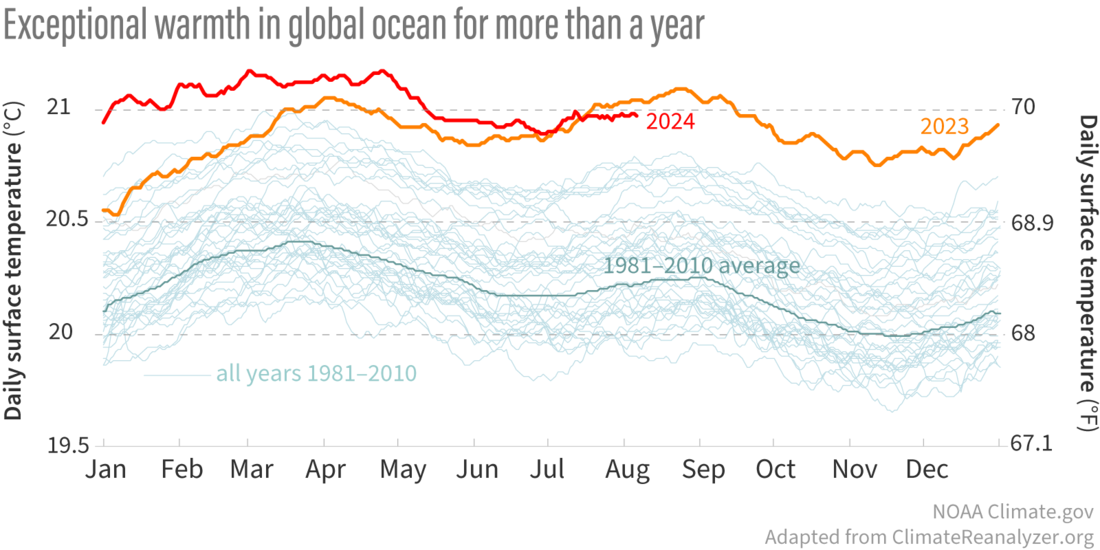
Daily surface temperatures for the global oceans between 60˚ North and South from 1981-2024 to date. From April of 2023 (orange line) through May 2024 (red line) temperatures were not only been much warmer than the 1981-2010 average (thick blue-green line), but record warm by a wide margin compared to all other years (thin blue-green lines). NOAA Climate.gov image adapted from Climate Reanalyzer. Explore NOAA's official monthly rankings with the Climate at a Glance tool from the National Centers for Environmental Information.
This overall heat brings me back to an excellent post Michelle wrote a few years ago describing the relative Oceanic Niño Index, which takes the temperature anomaly in the Niño3.4 region and subtracts the anomaly for the entire tropics. This helps to shine a clearer light on the local regions of relative warming or cooling across the Pacific, which is directly tied to increased or decreased tropical rainfall. While it is not NOAA’s official ENSO index, it is a newer index that the team monitors on the side.
Said more simply, it’s not just how much warmer or colder than average that part of the tropical Pacific is that jumbles up the tropical atmosphere, it’s the difference in warming or cooling compared the rest of the Pacific. And that’s where the relative ONI comes in!
So where do things stand? The regular ONI for May-July was +0.2°C. But the relative ONI was already down to -0.4°C. That means there could be a scenario later this year where the ONI is not yet below -0.5°C, but the relative ONI already is, and the atmosphere might start reflecting La Niña-like impacts. Doesn’t that seem like a pain to communicate? Tell me about it!
Luckily for me, if that does happen it will be Emily’s job to communicate it all when she’s back writing the monthly outlook posts next month. Sorry, Emily.
Comments
La Nina
The NMME plots for August look a lot like the NMME plots for July. Seems on the plots the CFSv2 is the outlier and most of the models are somewhere in between .5 and 1 around .75. Seems the CPC/IRI plots are about the same. The NMME seasonal outlook for winter looks alot like a La Nina seasonal precipitation map where the drier and wetter areas of the US look like. The Temperature outlook is interesting. The chart looks like almost the entire continental US will experience above average temperatures during winter according to the NMME. What do you think about all this?
Most models still have La…
Most models still have La Nina forming so it makes sense that the precipitation signal for winter reflects La Nina-like conditions. Climate models tend to latch onto that signal as it's the most predictable at this early a stage.
As for temperature, NMME still shows a colder than average signal across Canada for DJF and generally around average for the northern tier, so that signal is still there just not pushed as far south.
La Nina Temps
Thanks Tom!
if the dreaded La Nina winter pattern develops with the NP high which keeps California high and dry I would think that would result in the jet stream dropping cold arctic air into the midwest during the winter months. We are hoping not to experience one of the bone dry patterns during winter,
If this La Niña is a late…
If this La Niña is a late-blooming one where it isn’t officially declared until February or March of 2025, this will be very much like the 2005-2006 Season’s Weak La Niña, and the La Niña wasn’t officially declared until February 2006.
We won't have to wait that…
We won't have to wait that long to declare the event here. We'll declare La Nina present before it qualifies using the official metric of 5 consecutive 3-month seasons.
Possible Late-Blooming La Niña
I have a feeling that this is a late-blooming 2024-2025 La Niña where it won’t be officially declared until February 2025 or March 2025, similar to 2005-2006 Weak La Niña that wasn’t officially declared until February 2006. The subsurface is so cold that the pent up cold water now could mean a late-show 2024-2025 La Niña that stalled in June, but rebounds and shows up in February-March 2025 could give 2025-2026 Super La Niña a head start
Neutral ENSO year like 2001-02
Hopefully, of them La Nina a head start in 2029-2030,
After 2 years of Neutral of 2027-28, and 2025-26,
After 3 years of El Nino of 2026/27, was start dry Jan 2027, with no rain in Los Angeles.
the dog days of summer 2024…
the dog days of summer 2024 ended on the 11th of AUG.
About la niña
Probably this year la niña will not happen. The CFS model this a outlier. Several dinamical models back off la niña and now , showing a neutral Enso for 24-25. Middle 2025 will be a borderline neutral/El niño.
Meteofrance, Bureau (Australia), Ecmwf Copernicus, Jma, Gdfl spear, Sintex , Ncar , Cansips, Gem , now showing neutral Enso. Only CFS and NASA outliers.
2017 (January till may/June/July) forecast showed El niño in the late 2017. But , in September 2017 NOAA issued la niña watch and happened la niña 2017-18. Will this year to end with El niño?
La Nina
Australia has a different threshold for La Nina. Their threshold I believe is -.8. CFS seems to be the outlier but most of the models still show a La Nina occurring but a weak one. If you read the update above, they still project a La Nina most likely occurring during winter.
Above average ocean temperatures
I have also heard that ocean temperatures had set records every month for over a year (though I've heard that, last month, they were "only" the second-hottest ever recorded for a July). And, according to the graph, it looks like the ones for 2023 and this year have been a bit less than half a degree celsius higher than the previous range had been.
So, have there have been previous years where there was this much of a temperature anomaly compared to other years? If so, what impact did that have on ENSO?
La Niña is happening
La Niña is gonna be strong
La nina strength
This La Nina most likely will be a weak event
IRI/CPC Update
If the IRI/CPC update that came out today is accurate this will be a weak and short lived La Nina with ENSO neutral favored by JFM.
ENSO /neutral
If we are in ENSO / neutral. Why hasn't the Pacific Decadal Oscillation reading gone to 0.00 ? It been way negative since 2019. I would think that La Nina is already present and is reacting with the atmosphere ?
The PDO is different from…
The PDO is different from ENSO (more here).... while it can be monitored monthly/seasonal, it really is supposed to be an indicator for decadal (10 years or more) fluctuations. The PDO focus is also in the North Pacific Ocean, while ENSO is tropical. That the PDO is negative doesn't mean that ENSO will be too.
Add new comment