December 2024 ENSO update: party time, excellent
There’s a 59% chance that weak La Niña conditions will develop shortly. This is very similar to last month’s estimate, just applied to November–January. It’s true; if you read last month’s post, you can pretty much carry that information over to this month. However, we have lots of fun sciency details to talk about this month, so stick around!
The office holiday party
La Niña, the cool phase of the El Niño/Southern Oscillation (ENSO), is a coupled ocean-atmosphere pattern in the tropical Pacific Ocean. To qualify as La Niña conditions, we need to see (1) surface water in the tropical Pacific that is at least 0.5 °C (just shy of 1˚F) cooler than the long-term average (long-term=1991–2020) and (2) evidence of changes in the Walker circulation, the atmospheric circulation over the tropical Pacific. This evidence includes stronger upper-level and near-surface winds (the trade winds), more rain than average over Indonesia, and less rain over the central Pacific.
It’s important to have both the ocean and the atmosphere showing changes, because there are feedbacks between them (this is the “coupled” part) that help La Niña grow and stick around for several months. When La Niña (or El Niño, can’t forget him) are present, they change global atmospheric circulation in known ways, allowing us a window into potential seasonal temperature and rain/snow patterns.
Cocktails with your old friends
Speaking of the tropical ocean and atmosphere—where are they now? Our key monitoring index, the temperature of the surface water in the Niño-3.4 region, is still running just a little cooler than the long-term average. According to our most reliable long-term dataset, ERSSTv5, the November index was -0.2 °C. While below average, this does not exceed the La Niña threshold of -0.5 °C.
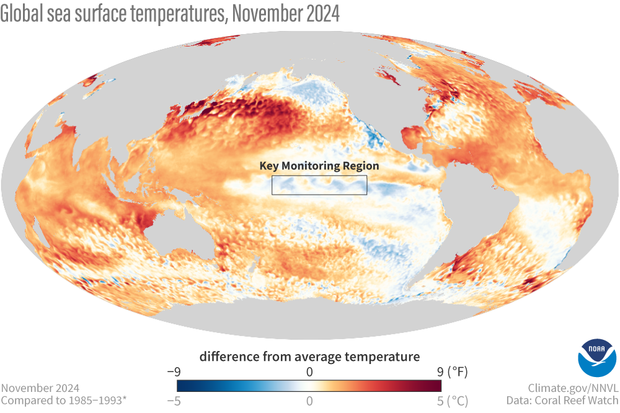
November 2024 sea surface temperature compared to the 1985-1993 average (details on climatology from Coral Reef Watch). The box indicates the location of the Niño-3.4 ENSO-monitoring region in the tropical Pacific. The surface of the east-central tropical Pacific is slightly below average temperature, but much of the global ocean remains warmer than average. NOAA Climate.gov image from Data Snapshots.
Global ocean temperatures have been running way above average for more than a year now, and as you can see from the map above, November was no exception.
Meanwhile, looking up, we see an atmosphere that is showing signs of a Niña-ish pattern. In November, the trade winds were stronger than average, upper-level winds were also stronger, and the tropical Pacific was much less rainy than average. I’ll have more details on this in a few paragraphs.
Dance club
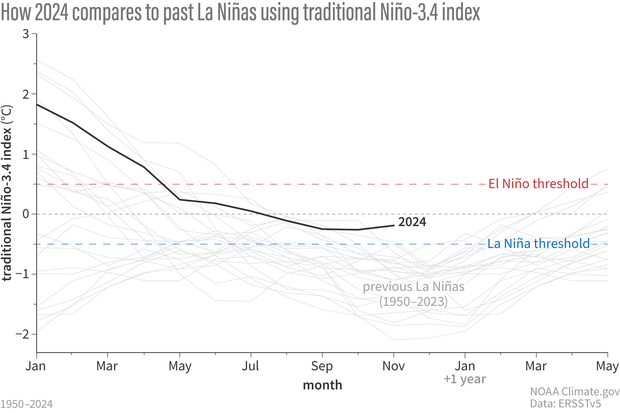
Let’s look at that Niño-3.4 sea surface temperature compared to all the La Niña events since 1950. As you can see below, the Niño-3.4 Index decreased sharply after the peak of last winter’s El Niño, but kind of stalled out in the spring and has been solidly in ENSO-neutral territory for months now.
How sea surface temperatures in the Niño-3.4 region of the tropical Pacific changed over the course of all La Niña events since 1950 (gray lines) and 2024 (black line). This shows the traditional calculation for Niño-3.4, the monthly temperature compared to the most recent 30-year average (1991–2020 for the 2024 line). By this measure, the La Niña threshold has not been crossed, and ENSO is still neutral. Climate.gov graph, based on data from Michelle L’Heureux from CPC using ERSSTv5.
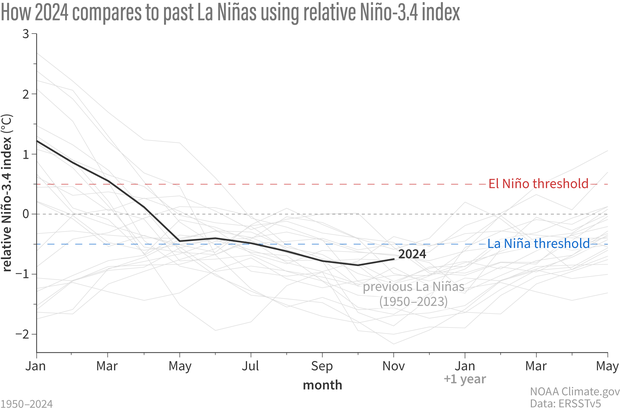
However, that lit-up global ocean we see in the map above may be getting up in ENSO’s grill. Over the past few months, we’ve talked about the Relative Niño-3.4 Index, which compares the Niño-3.4 region to the rest of the tropical oceans. When you take the traditional Niño-3.4 and subtract the tropical average ocean surface temperature, you find a Relative Niño-3.4 Index that dips past the La Niña threshold (see footnote for additional details on Relative Niño-3.4 calculations). In short, the traditional Niño-3.4 says no La Niña yet; the relative index would say we’re already there.
How sea surface temperatures in the Niño-3.4 region of the tropical Pacific changed over the course of all La Niña events since 1950 (gray lines) and 2024 (black line), based on the relative Niño-3.4 calculation. Here, the monthly temperature is compared to the most recent 30-year average, but then the tropical average ocean surface temperature is subtracted, to account for global ocean warmth. By this measure, the La Niña threshold of 0.5 °C has been crossed. The relative Niño-3.4 index is not our official metric, though, and it needs more research. Climate.gov graph, based on data from Michelle L’Heureux.
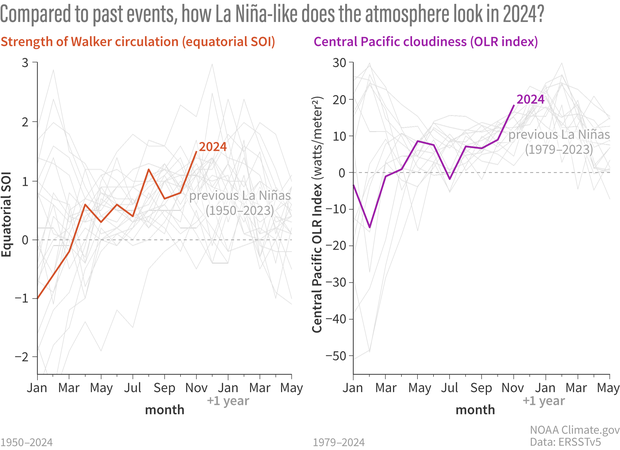
With that in mind, Michelle investigated some measurements of the atmospheric component of La Niña. Specifically, she graphed the Equatorial Southern Oscillation and the amount of clouds in the central tropical Pacific. The Equatorial Southern Oscillation compares the surface pressure in the eastern equatorial Pacific to the western. When it’s positive, that means the western pressure is weaker than average and the eastern pressure is stronger than average, indicative of a stronger Walker circulation—La Niña’s signature.
Clouds are estimated with satellite observations of outgoing longwave radiation, or “OLR” for short. Very cold surfaces, like the top of a deep thunderstorm cloud, emit less OLR than a warmer surface, like a cloud-free ocean. Therefore, more OLR generally means fewer clouds. Fewer clouds in the central tropical Pacific is also a La Niña signature move.
We don’t use these monthly atmospheric indexes for declaring ENSO events, because they are much more variable (they jump, jump around) than the ocean index. You can see this in how zig-zaggy the lines are in the below graphs compared to the above. They are very useful for understanding how conditions are evolving, though.
Two ways of looking at the atmospheric conditions in the tropical Pacific: the Equatorial Southern Oscillation (left) and cloudiness in the central Pacific (right). The colored lines show 2024, while the gray lines are every La Niña on record. Both measurements provide evidence that the Walker circulation is stronger than average, a La Niña atmospheric signature. Climate.gov graph, based on data from Michelle L’Heureux.
When Michelle graphed these two atmospheric indexes, she found that they both looked pretty darn La Niña-y. (In these graphs, higher numbers are more like La Niña). In fact, the OLR from November 2024 ranks higher than any previous La Niña! However, these numbers do change a lot from month to month because of other subseasonal patterns like the Madden-Julian Oscillation (which was active), so it could bounce back down into the mosh pit next month.
Afterparty
So what do we take home from all this? The atmosphere looks like La Niña, and has for a while, but the ocean doesn’t, at least by our traditional sea surface temperature measures. Forecasters still think it’s likely that the traditional Niño-3.4 Index will cross the threshold soon, in part helped along by the strong trade winds, which cool the surface and keep warm water piled up in the far western Pacific.
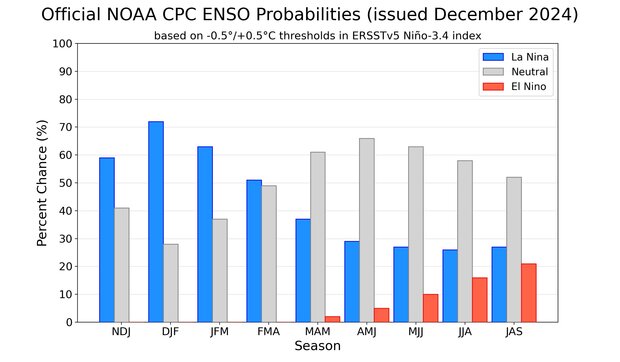
Out of the three climate possibilities—La Niña, El Niño, and neutral—forecasts say that La Niña conditions are the most likely for the November–January season (blue bar over the NDJ label, 59% chance). NOAA Climate Prediction Center image.
But even if we do declare a La Niña Advisory soon, it will very likely be a weak event at most. Check out Nat’s recent post for the implications of a weak La Niña on North American winter forecasts.
This is very much a developing story—you’re reading about scientific development and discovery in real time. Our official ENSO metrics may not describe ENSO quite as well in the context of the much-above-average global ocean temperatures we’ve seen over the past year, but we don’t know yet if the relative Niño-3.4 Index is going to consistently describe ENSO better into the future. We need more research to better understand what is happening.
What we do know is that the ENSO Blog is going to keep you up to date and make sure you’re never late to the party!
Footnote
After you subtract the tropical average (20°S–20°N) sea surface temperature anomalies, the difference has lower variance than the original SST anomalies. This is why the computation of relative Niño-3.4 also has a variance adjustment where you multiply by a scaling factor (ratio of the standard deviation of the SST anomaly with the standard deviation of the difference index). If you want to see how this really works, here is some github code to compute relative ONI using observations. In the relative SST map above, the standard deviation of SST anomaly at each grid box is used instead of the standard deviation of the Niño-3.4 index.
Comments
Clarifying
You folks do a great job with these updates and I enjoy the writing style you bring into them...
To be clear...IF a La Nina is declared it will be based on the traditional method and not the relative index correct?
Also might be interesting to break out the La Nada snow climo/anomaly maps just in case.
Much appreciated Joe! If La…
Much appreciated Joe! If La Nina is declared it will be based on the traditional method and not the relative index. That is correct.
Snow or rain
I'm a skier located under the green blob in upper Montana and wondering if the increased precipitation will be rain or snow? Last year we got rain in December which melted a lot of the base. This year we have a small to moderate base, but the current 10-day temp outlook is 35-40 degrees, which could be a repeat of last year.
Do the increased ocean temps necessarily mean an increase in air temps? Are we just as likely to have rain rather than snow?
Thank you, love the blog!
Late-Show Weak 2024-2025 25 Niña, but Stronger 2025-26 La Niña?
I wonder if this La Niña will be a late-blooming La Niña if/when it is declared, it is declare quite late in the season (similar to 2005-06 Weak And Short-Lived La Niña that was not officially declared until February 2006), but even it disappears early it still helps give the La Niña-like atmosphere a head start to allow a Stronger (Weak To Moderate Or Stronger) 2025-2026 La Niña (like when 2016-17 Weak And Short Lived La Niña disappeared in February 2017, it helped give the La Niña-like atmosphere a head start to allow a Stronger (Weak-To-Moderate) 2017-18 La Niña to develop late in the season by October-November 2017)
That is a good question. At…
That is a good question. At this point if La Nina does form, it will already be the definition of a late-bloom La Nina! But as Emily notes above, the tropical atmosphere already reflects La-Nina like conditions, and it is entirely possible that we see La-Nina like influences on the climate across North America during this Winter.
Relative Nino Index
Yes, its worth checking out Relative Nino Index. However, this should be historically verified for a long period (30years).
The base period changes every 5 years for the ERSSTv5 dataset, as outlined in Huang et al. (2017, J. Climate).
At present the base period for calculating SST anomalies is updated every 5 years to account for the long-term warming trend in the ocean. This ensures that El Niño and La Niña anomalies are reflective of current climate conditions rather than being skewed by historical temperature averages. The current base period used is from 1991 to 2020.
By updating the base period, the calculation avoids the issue where a fixed historical base period would increasingly define conditions as El Niño due to the gradual warming of the ocean. For instance, using an outdated base like 1856-1885 would result in almost perpetual El Niño conditions under current sea temperatures.
The base period from 1991-2020 is used and this will change to 1996-2025 in a years time.
This method has ensured that the ONI remains relevant and accurate in diagnosing ENSO phases amidst a changing climate.
Hi-- the problem with the…
Hi-- the problem with the 30yr moving average is that it doesn't keep up with changes in the last ten years or so. In the historical record, we eventually center the 30yr average, but you can only use the last 30yrs in real time, which means it is a lagging indicator. We are currently noticing 0.5C+ differences between our current method of computing ONI and Relative ONI. This is quite an offset and points to one limitation of the moving 30yr method to deal with trends.
Wind Shear?
Thanks for the interesting post!
As I understand, ENSO affects Atlantic storm formation via reduced wind shear. Is it possible to characterize wind shear conditions in 2024 relative to past declared La Nina events? In that context, was 2024 more similar to neutral or La Nina conditions?
Excellent question. And one…
Excellent question. And one I had to consult another colleague at NOAA's Climate Prediction Center.
Looking at the August - October period, the wind shear between 200-850hPA in the Main Development Region was the lowest in the 1950 to present period
Image caption
Wind shear values in the Atlantic Ocean's Main Development Region for tropical cyclones for the August - October period from 1950-2024. Image provided by NOAA Climate Prediction Center
It means No La Nina or El…
It means No La Nina or El Nino for this 2025/26, it's still a Neutral ENSO year, yep
Following the moderate El nino by 2026-2027, after in Southern California, we had dry October with very little rain, then above average wet rain in November and December 2026. Then follow the dry and warm January 2027, with multi-week dry spell, no rain, then First rain in February and March then April and May 2027.then June was very little rain was 0.01 inches!
I wonder if this La Niña…
I wonder if this La Niña will be a late-blooming La Niña if/when it is declared, it is declare quite late in the season (similar to 2005-06 Weak And Short-Lived La Niña that was not officially declared until February 2006), but even it disappears early it still helps give the La Niña-like atmosphere a head start to allow a Stronger (Weak To Moderate Or Stronger) 2029-2030 La Niña
No time for a La Niña
The criteria for a La Niña is five consecutive periods of three months (7 months) with an average anomaly of < -0.5°C. Even if December reaches that anomaly, which is doubtful, the anomaly would have to extend into April to fit the criteria, something that is not going to happen.
Isn't it time NOAA throws the towel and admits there will not be a La Niña in the 2024-25 season? That would be better than changing the data to fit the prediction.
If NOAA wants to improve its ENSO prediction skills they should take into account the solar cycle. A La Niña during a solar maximum year is very unlikely. My prediction since May has been for a neutral year.
La Nina
This has been looked at extensively. As was posted here, the relative index is stronger than the Nino 3.4 figure. The surrounding warm SSTs enhance La Nina's cool water along the equator. Other signs point to the atmosphere responding to La Nina. Surely the outcome with a dry southern two-thirds of California and dry pacific southwest points to the existence of La Nina
You are dead on, but I would…
You are dead on, but I would like to add my opinion that weather modification, ie: chemtrails, etc, are and have been, affecting the weather for quite some time now.
SST "variance adjustment" - Uh oh?
Enjoyed this post tremendously, extremely informative and a wonderful insight into how ENSO predictions work!
The "variance adjustment" mentioned in the footnote(!) is maybe the key takeaway (for me anyway).
It is incredible predicting / measuring planet Earth's atmospheric trends is in the midst of needing these adjustments, just to keep up with imminent (not future "imagined") changes. Are these changes authorities in positions of leadership at the international level, nation level and transnational corporate level seem to only reluctantly acknowledge as footnotes? Sure seems like it, and sure seems kinda, well, silly, if we're being polite.
The fact the global multi-trillion dollar insurance industry & global national security bodies are extremely well apprised and following these changing trends very, very closely, should "destigmatize" all greenwashing marketing speak about this planet of 8 billion and counting!
Got to tell it like it is, to be able to deal with what is after all! Intellectual (and literal) smoke and mirrors aren't going to stop what's happening now!
Please keep up this excellent, crucial work ENSO team.
Niño 3.4 index
Hello from Hong Kong! Thank you for making such educational & interesting content about ENSO.
Just want to make sure I am understanding this correctly: for the figures "How 2024 compares to past La Niñas using traditional / relative Niño 3.4 index", is it correct that both indices are 3-month running mean? i.e. the value shown for November is the mean of SON period?
These figures show the 1…
These figures show the 1-month Nino-3.4 index, so the value shown for November is the average for the month of November.
Solar Storm
So, with a solar Storm predicted for 2025, the worst since 1859, can we expect changes in the tropics for El Nina predictions? Call me fire and water.
Add new comment