Keep calm and stop obsessing over weekly changes in ENSO
“El Niño is Strong!”
“No, it’s Moderate!”
“But the [insert your favorite ENSO indicator here]
is the largest it’s been since the El Niño of 1997-98!”
We are now nearing 1.5 degrees Celsius in the Niño-3.4 index for a 7-day or weekly average. Among the post-college age crowd who can remember it (yes, this officially means you’re old), the level of warmth in sea surface temperatures this time of year harkens back to 1997-98 El Niño, which ended up becoming a record strength event.
Are these weekly numbers impressive? Yes. But when a weekly value hits 1.5°C is El Niño instantly considered strong? I’d argue no. While a short-term (daily or weekly) number might be striking, it shouldn’t be used as an indicator of El Niño strength unless it is carefully placed into a larger context. Here are some reasons to be careful about gauging El Niño strength on a sub-monthly basis:
(1) Weekly conditions in the tropical Pacific aren’t related to global impacts. Take, for example, the 1.0°C value in the Niño-3.4 index during late November of 2014. Did that warrant its consideration as a moderate-strength El Niño (footnote 1)? No, in large part because the atmosphere didn’t react. The following week, the anomaly decreased to 0.8°C. Did that mean it went from “moderate” to “weak” in the span of 7 days? Of course not. It means that we shouldn’t make a big deal out of changes in weekly values—or “wiggle watching,” as my colleague Andrew Watkins at the Australian Bureau of Meteorology likes to say.
(2) Weekly averages bounce around because… you know, weather. It is not unusual to see jumps of several tenths of a degree from week-to-week. This is because there are shorter-term changes in the ocean and atmospheric circulation that can be related to faster, non-ENSO phenomena, such as the Madden Julian Oscillation, which happens to be currently in place and is influencing the tropical Pacific. With short-term changes, we cannot be sure they reflect El Niño, which evolves more slowly. As Emily has pointed out, watching El Niño is akin to watching a rock within a flowing stream. If water pushes around the rock then the El Niño classification may not be stable. But if it stays in place for a longer period of time, then it is more likely a real indicator of El Niño strength.
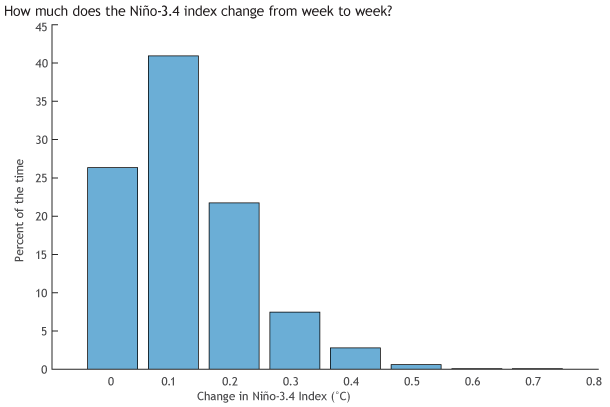
How often and how big is the change in Niño-3.4 index values from one week to the next? The change is an absolute value meaning that the sign (increase vs. decrease) of the change is ignored. Weekly averaged OISSTv2 data is used from January 1990 through June 2015. Image by Climate.gov based on data provided by the Climate Prediction Center.
(3) The squishiness of rankings. Remember, El Niño is based on both the ocean and atmosphere. There are many different data sets and methods to compare and measure strength. Some use sea surface temperatures in degrees Celsius in a certain region, like Niño-3.4, to define strength (footnote 1). Based on one index and one dataset, the current 2015 April-June average value ranks as the fourth largest April-June El Niño since 1950. Some prefer “standardized anomalies,” in which case—breaking news flash—El Niño is already strong with a value of 1.6, which is the 95th percentile (95%) of all AMJ Niño-3.4 index values (footnote 2). While impressive, this is only one index and dataset. And, remember, during the summer, El Niño is fairly irrelevant to the United States (but it is more important to certain locations in the Tropics and Southern Hemisphere).
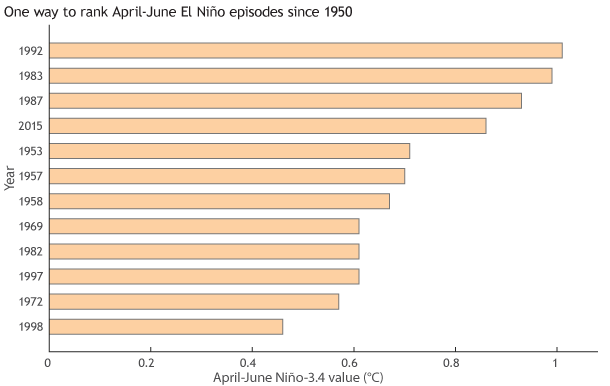
A ranking of April-May-June Niño-3.4 index values based on past El Niño episodes going back to 1950. Monthly averaged ERSSTv4 data (created by NOAA NCEI) is used to form the seasonally averaged index, which is also known as the Oceanic Niño Index (ONI). Note that some of the years listed were El Niños that were in decay and not growing as in the current event. Image by Climate.gov based on data provided by the Climate Prediction Center.
(4) For a snapshot in time, there might be a certain atmospheric or oceanic feature similar to the 1997-98 strong El Niño, but there are other features that are not. For example, another ENSO measure, the Southern Oscillation Index, was temporarily positive earlier in late June 2015. Was that like the strong 1997-98 El Niño? No, that was more in the direction of La Niña, the opposite of El Niño. There are many aspects of ENSO to compare, in different locations and altitudes/depths of our ocean and atmosphere.
(5) Current observed conditions are not the same as a forecast for the future. While a certain feature may be eye grabbing and it could persist, it does not mean that it will continue. This is important as ENSO has its strongest impacts over the U.S. during the winter. The fact there might be similarity to 1997-98 more recently does not mean it will be this strong come winter. Tony discussed so-called analog prediction (when you make a forecast by comparing current conditions with similar conditions over past history), and he explained that it is a poor performer compared to today’s state-of-the-art models. With all that said, the official ENSO outlook, which uses models and other guidance slightly favors a strong El Niño come winter.
But why does strength even matter? As you can probably figure out by now, I’m a nerd who enjoys coding and playing around with numbers, and there are a nearly infinite number of ways to splice and dice data to estimate strength. But I always try to step back and establish my goal. A label or ranking is only as useful as its purpose.
At NOAA CPC and the IRI, we mainly use ENSO status and strength to say something about the coming seasonal impacts on temperature, precipitation, and tropical storm activity. As a rule-of-thumb, the stronger the El Niño event, the more reliable or confident we will be in the impacts, which is why Tom recently pointed out El Niño is a climate forecaster’s best friend.
We often emphasize 3-month, or seasonal, averages to assess the strength of El Niño. We also focus on the Northern Hemisphere late fall, winter, and early spring seasons because that is when impacts are the greatest over North America. So, those are the seasons and impacts that will be most important for ranking the current El Niño and deciding whether this event will be on par with the 1997-98 El Niño.
Footnotes:
(1) NOAA CPC informally categorizes historical El Niño events using half-degree Celsius increments in the Niño-3.4 region in the east-central tropical Pacific Ocean. But this comparison is only used for 3-month (seasonal) averages. Weak is generally regarded as 0.5°C to 0.9°C, Moderate is 1.0°C to 1.4°C, and Strong is 1.5°C or greater. During the Northern Hemisphere winter, these categories contain about 23% (strong), 30% (moderate), and 47% (weak) of all El Niño events. This is not an official classification and usage will vary depending on the specific application or purpose.
(2) “Standardizing” means indicating how many standard deviations a number is from the average. It is also explained in Tony’s previous blog post. In this case, I’m assuming the data is normally distributed and I am using the ERSSTv4 dataset from NOAA NCEI (see Huang B. et al. 2015 J. of Climate).
Comments
ENSO and following winter forecast
Strong La Ninas Bracketing Exceptionally strong El Ninos?
RE: Strong La Ninas Bracketing Exceptionally strong El Ninos?
:-) Even folks who have been researching ENSO for decades are learning something new all the time, so don't worry. Your diagram is one way to examine ENSO variability, but I find these links to be an easier way to examine historical ENSO fluctuations-- and they go back to 1950:
http://www.cpc.ncep.noaa.gov/products/analysis_monitoring/ensostuff/ens…
http://www.cpc.ncep.noaa.gov/products/analysis_monitoring/lanina/enso_e… (see slide #21 for time series of ONI/Nino-3.4 index)
What we notice from looking at these time series is that stronger El Ninos are often followed by La Nina the next year. There are fairly well-founded physical mechanisms (recharge-discharge) that explain why this is probably the case despite the small number of "strong" El Ninos in our historical record. However, the inverse is less likely. That is, El Ninos (strong or not) are not often preceeded by La Nina (in the previous year).
El Ninos?
The Blob
RE: The Blob
In the Tropics, we talk a lot about "coupling" between the ocean and the atmosphere. That is, ocean temperatures often drive the atmosphere and, vice versa, the atmosphere helps to force the ocean. This forms the basis for ENSO.
However, in the Extratropics (or higher latitudes that are farther away from the Tropics) this coupling is much weaker and one way. This is because the physics in the Extratropics are different than in the Tropics. In the Extratropics, like the North Pacific Ocean where "the blob" resides, the ocean temperatures are often caused (or driven) by the overlying atmospheric circulation and wind patterns. But the opposite is often not the case -- *especially* on seasonal timescales. That is, the North Pacific Ocean temperatures ("the Blob") is not the main culprit for the large-scale circulation/wind patterns that lie above it. Quite often, especially over the North Pacific and North America, it is changes in the *Tropics* that drive the atmospheric circulation that influences the Pacific Northwest (PNW).
So, in making the forecast for the Pacific Northwest for the coming winter, forecasters will likely be much more concerned with the state of El Nino than in the state of the Blob. The Blob can have more local impacts (warmer conditions right by the coast), but it is not expected to have a big impact on the larger scale circulation.
Comments have been disabled on this article