March 2022 La Niña update: three-bean salad
Three-bean salads are a blend of sweet-sour tastiness, implying all good things come in threes. Well, depending on your opinion of La Niña, maybe not all good things, as La Niña—the cool phase of the El Niño-Southern Oscillation climate pattern—reasserted itself in the tropical Pacific this past month with some of the strongest atmosphere-ocean coupling of our double-dip La Niñas so far (winters of 2020-21 and 2021-22). La Niña is now favored to continue into the Northern Hemisphere summer 2022, with nearly equal chances of ENSO-neutral or La Niña thereafter. Is a La Niña three-peat in the offing?
Three-dimensional
Back up, La Niña strengthened in February? It did, despite the fact that sea surface temperatures in the key monitoring region of the tropical Pacific, the Niño-3.4 region, appear to have bottomed out in December, with a monthly value of -1.1°C (ERSSTv5 data set). Since then, the monthly values have warmed slightly, though February 2022 remained chilly at -0.9 °C. However, the February average smoothed out some notable variability: the weekly average Niño-3.4 index was -0.6 °C at the beginning of February and then decreased to -1.1 °C in the past week. Quite a dive!
Sea surface temperatures in the tropical Pacific Ocean from mid-January through February 2022 compared to the long-term average. East of the International Dateline (180˚), waters remained cooler than average, a sign of La Niña. Graphic by Climate.gov, based on data from NOAA’s Environmental Visualization Lab. Description of historical baseline period here.
Confused by all the numbers for presumably the same Niño-3.4 sea surface temperature index? Don’t be-- averages for shorter time spans can fluctuate around a lot more than longer averaging periods. This is the difference between weather and climate. Day-to-day or week-to-week weather can change a lot relative to monthly and longer seasonal climate averages, which do not vary as much. Even as the weekly and monthly values have jumped around, the Oceanic Niño Index (ONI), NOAA’s official measure of ENSO, has remained constant at -1.0°C for the third, overlapping season in a row.
One of the major challenges in ENSO prediction is trying to untangle meaningful seasonal swings in the tropical climate from the shorter-term noise of tropical weather. In February, along with cooling off of sea surface temperatures, we saw a stronger Pacific Walker circulation: a strengthening of trade winds along the surface of the equator (blowing from east-to-west), stronger winds in the upper tropical atmosphere (that blow from west to east), significant drying over the Date Line, and increased rainfall anomalies over the Maritime Continent. All of these features are consistent with a healthy La Niña.
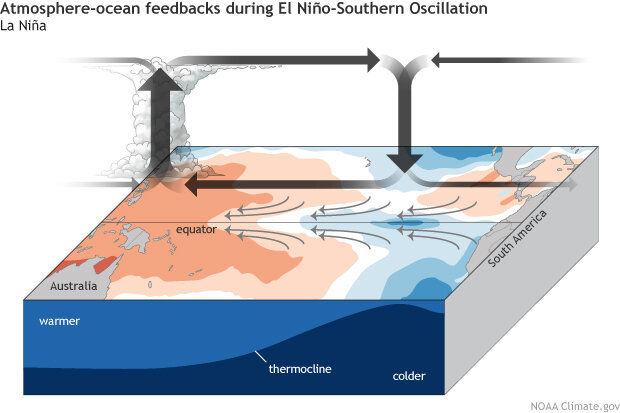
During La Niña, the surface trade winds (small gray arrows) blow more strongly than normal, piling up warm surface water in the western Pacific and drawing up deep, cool water in the eastern Pacific. Over the warm waters, the air becomes more buoyant (upward thick arrow), and rainfall increases. Over the cool waters, it is less buoyant, favoring subsidence (downward gray arrow) and less rainfall. These feedbacks between ocean and atmosphere strengthen the La Niña event. Climate.gov schematic by Emily Eng and inspired by NOAA PMEL.
In fact, by some of our atmospheric measures—the Equatorial Southern Oscillation Index and Central Pacific Outgoing Longwave Radiation index (a measure of equatorial rainfall)—we saw some of the largest monthly values dating back to the start of the first La Niña event in the autumn of 2020! The Pacific Walker circulation was clearly juiced up in the past month and is probably why we saw weekly Niño-3.4 sea surface temperatures take a tumble.
With that said, one month doesn’t make an entire season, and it may have been a short-term swerve on the road to the dissipation of La Niña, as it typically does, through the spring and summer. It’s enough to have at least slowed down La Niña’s exit from the global climate stage, but does it portend more meaningful change going forward? We’ll get back to that later.
Three-legged race
What does the continuation of La Niña mean for impacts during the March-May season over the contiguous United States? As regular blog readers know, the two biggest drivers of seasonal climate outlooks are ENSO and climate trends. The images below show the average March-May temperature and precipitation patterns we’d expect based on the combination of historical La Niña patterns and recent (10-15 year) climate trends.
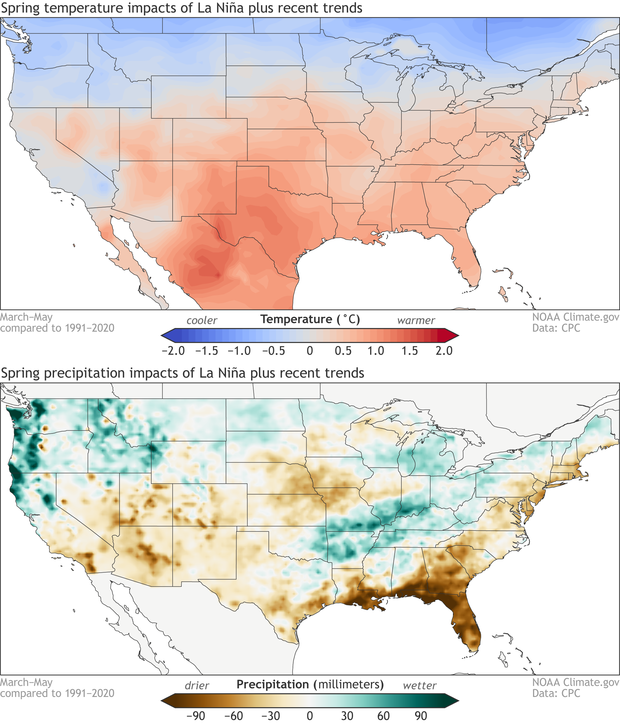
March-May average temperature (top) and precipitation (bottom) compared to the long-term average for the combination of historical La Niña events and climate trends. Data is based on the CPC ENSO composites and modified by Climate.gov.
As one might expect, NOAA CPC’s official seasonal outlooks for March-May 2022 resemble the patterns above with some exceptions. In general, above-average temperatures are favored over a large part of the contiguous U.S., with the exception of the northwestern U.S., where below-average temperatures are more likely. Above-median precipitation is expected over the northwestern U.S. and the Ohio and Tennessee valleys. Below-median precipitation is favored over most of the southern U.S., extending northward into Utah, Colorado, and parts of the western Great Plains (footnote #1).
In addition to these potential temperature and precipitation anomalies, it is also worth checking out a previous article by Mike Tippett and Chiara Lepore on ENSO and Tornadoes. During La Niña, springtime severe weather can be more active in parts of the southern/southeastern United States (though not a guarantee as John Allen explained to us after the 2020-21 La Niña).
Three’s a crowd
Despite a few forecast models suggesting otherwise, below-average sea surface temperature patterns are likely to weaken across the tropical Pacific as we go through the spring, but it’s still an open question how much they will weaken. Will they weaken enough to eventually return to ENSO-neutral (near average conditions across the tropical Pacific)? And when would that happen?
This month the crystal ball became blurrier, with a 54% chance that La Niña persists into June-August 2022. And, after that, it’s pretty much a split between ENSO-neutral and La Niña through the fall, with neither outcome exceeding a 50% probability (and El Niño still has a 10-15% chance!). Thus, reading between the lines, odds for a La Niña three-peat have gone up (Emily first blogged about this possibility in November 2021), but nowhere near certainty. Keep in mind, the accuracy of ENSO forecasts made this time of year are, well…not so great.
Also, La Niña three-peats (triple dips?) are very rare—only two exist in our more reliable historical record going back to 1950 and both occurred after major El Niño events, which our current event did not. The time evolution of the Niño-3.4 index for the two La Niña three-peats is featured in the darker blue lines in the image below. It is also interesting that out of the eight double-dip La Niñas in our historical record, three ended up evolving into an El Niño for the third winter (red lines) and the remaining three ended up on the cooler side, close to La Niña thresholds, but were ultimately classified as ENSO-neutral winters.
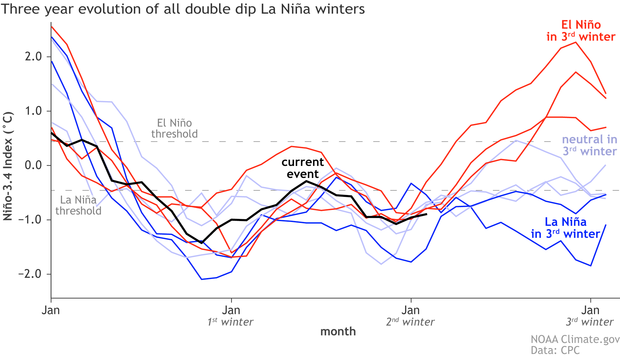
Three-year history of sea surface temperatures in the Niño-3.4 region of the tropical Pacific for 8 previous double-dip La Niña events. The color of the line indicates the state of ENSO for the third winter (red: El Niño, darker blue: La Niña, lighter blue: neutral). The black line shows the current event. Monthly Niño-3.4 index is from CPC using ERSSTv5. Time series comparison was created by Michelle L’Heureux, and modified by Climate.gov.
To get to a third consecutive La Niña winter we would need to see ongoing, enhanced easterly trade winds and, also, the replenishment of below-average temperature “fuel” in the subsurface equatorial Pacific Ocean. In February, at least, we saw some trends in this direction.
So, is this two steps forward, one step back? Or three steps forward? Stay tuned next month when Emily returns from vacation. If we’re lucky maybe she’ll include some pretty tropical photos. Maybe three of them.
Comments
Third Year La Nina
We will be praying for La Nina's demise and at least going to ENSO Neutral next year. La Nina has been nothing but bad for California so this is not a good thing that comes in threes. We have not experienced the expected outcomes from a La Nina spring even in Northern CA. The map above shows above average precipitation for Northern CA but all models now point to below normal precipitation throughout all of California for the next three months. We haven't experienced meaningful rain since December and our historically two wettest winter months have been bone dry. So I say La Nina die
Mediterranean-like climates
This is a long range bit : California and North Australia have mediterranean-like climates, during weak-moderate lanina's the precipitation prefers the land more often during winters for successive laninas if you consider the years 1970-1976 as an example and do re-analysis with the climate re-analyzer and see how it behaves over successive laninas although i do agree that No seasons would look alike in general . also, climatic forcing associated with volcanic major eruptions have positive impact on cooling and precipitable water of mediterranean like climates .
La Nina
It isn't land vs ocean. La Nina ultimately effects the North Pacific and favors North Pacific ridging which can effect the entire western half of the country. This has been felt in Colorado also.
Three's a Crowd
EXACTLY what I was thinking also.
La Nina PHOOEY!!!!
I hope this La Nina does die - or just ANYTHING to relieve this ongoing severe DROUGHT from which California continues to suffer. It is SO depressing & very worrisome, with reservoirs practically dry & horrific fire potential always lurking too close. I'm afraid that far too many Californians, especially those living in So CA like me, do NOT take this drought situation seriously & continue to pour water onto their dry thirsty lawns & to generally NOT conserve water! Was SO excited with such nice December rains but since then? NADA!!! Dear Lord in Heaven above, PLEASE send us RAIN!!!
drought
I hear what you're saying! We'll be right there with you hoping for some relief from the western drought.
Take some of ours!
This is a particularly dry continent. But - It's been raining pretty much non stop on the east coast of Australia. A very wet summer with the prospect of a wet winter to follow. Here we are in autumn, nervous. Catchments are saturated and 1 in 100 year flood events have happened 2 months in a row.
So please, take some of our rain!
My Dad used to say, too much of anything is not a good thing. Applies to La Nina as well!
Third year La Nina
I agree! We live in the Pacific Northwest and are freezing! It’s 10-15 degrees cooler than normal and rarely stops raining. April was the coldest here on record. We’ll gladly trade you some rain for some sun.
One man's demise is another man's blessing
In South Africa we welcome La Nina because it means we get rain in our rather dry country. The rains came late in 2024 but just in time to avoid a disastrous drought. Plentiful rain from just before New year has meant that our reservoirs are now full and even overflowing. Johannesburg's main water supply reservoir (Vaal Dam) was down to 25% of capacity and we were staring at a major water crisis during our normally very dry winters.
3 bean salad?
Apologies, but I don’t understand your 3-bean salad analogy... please translate.
3-bean salad
A three-bean salad is a common side dish in parts of the U.S. especially for cookouts and pot-luck meals.
Michelle used the analogy to describe the possibility that the current la Niña event, which has gone on for two winters now, might occur again in the coming (third) winter in a row.
3 Bean Salad
It's also available in every grocery store in America. The deli usually sells it by the 1/4 pint, 1/2 pint, or pint togo.
Thank you
Thank you Michelle for the updates .
By considering the patterns for the last 60 years it appears the odds of three consecutive and even four consecutive laninas are not unexpected . particularly between 1970-1976 there have been laninas uninterrupted, 1954-1956 two in a stretch also 1988-2001 three in a raw . I am not certain what fed their occurrence and re-occurrence that time but most likely preindustrial records may also show several events of occurrence and reoccurrence . i appreciate your help with information on the enso status for the years 1850-1950 if any is available .
Again, thank you ,
Warmest Jordanian Regards
Mohammad Alkhateeb ,
Four Year la Ninas
Four Year la Nina has never happened before and his highly unlikely. Still unlikely La Nina happens next year. Don't bet your house on it
4 year la nina
It may seem a little counterintuitive but it could very well happen due to global warming as the glaciers in Alaska and Canada continue to melt, dumping even more cold into the already chilly California Current headed south, while the melting of the ice caps down in Antarctica and Patagonia keeps adding more fuel to the icy Humboldt Current heading north up the South American coast and converging together at the equator and moving west and as the cold water spreads west it creates even more upwelling in the E. Pac., further compounding the La Nina and the long-term cold-phase PDO.
In contrast the colder climate of the pre-industrial the Arctic and Antarctic remained frozen all-year-round, reducing the input of cold water and weakening both the California and Humboldt Currents, and allowing for more big El Nino's and longer "warm" phase PDO's as well as pushing tropical waters from the western/central Pac. towards the eastern Pacific due to the westerlies being stronger and closer to the equator.
Don't see La Nina that way
Don't see la Nina temps in the TP being fed that way at all
La Nina science
Love this post which gives a suggestion of 'how & why' the patterns of La Nina are what they are. It seems important to combine the science of prediction and probability with the science of climate change. In Colorado, we all seem 'surprised' when another wildfire breaks out IN APRIL. If we made room to learn from scientists studying climate change we would have more understanding and less surprise.
Three-Bean salad?
I like the three bean salad analogy . It makes a statistical sense to think of like that . uncertainity always prevail in our outlooks . The reality is when expected and observed patterns fit with each others and i pray for a third weak lanina because it is associated with better favorability of rain for East Mediterranean in GENERAL . We're fed up with persistent droughts for four decades now .
BR
Mohamed
Alaska
Ok Alaska weather has been all over the map. We had joy at zero early on and February has been awful, too warm 32* plus. So what has La Niña got for summer up here in Alaska
La Niña (and El Niño) don't…
La Niña (and El Niño) don't have very strong impacts in the Northern Hemisphere during summer. Check here for maps showing summer ENSO climate impact patterns.
3-bean salad
Love my 3 bean salad in the summer! Thanks for the post.
When I sort the Feb PDO values, I noticed that Feb/2022 is the 7th lowest since 1854!
1949 -3.17
1956 -2.28
1866 -2.27
1894 -2.17
1950 -2.17
1873 -2.11
2022 -1.98
What factors caused the extremely low value for Feb 2022?
Interesting! And apparently…
Interesting! And apparently the lowest Feb. value since the 1950s. Hard to say what caused that, but it will certainly be an interesting research topic!
Extremely high
Why the lowest, the February month 2022 appears to be the highest not the lowest of all years .
PDO
I think it is the highest value of the 7 listed, but that means it's the 7th lowest since there are only 6 values that are lower.
Arriaga
Event El Niño 2023???
unlikely, at least early 2023
It's not out of the question, but likelihood of El Nino by early 2023 does not look high. Of course, the forecast can change, and it's too early to comment on the forecast for later in 2023.
I prefer a four bean salad...
All beans are legumes, but legumes aren't necessarily beans. So, now I'm wondering what a fourth year might bring...unprecedented, never seen before record weather? ;)
You're thinking a little…
You're thinking a little farther ahead than we are at this point - a third year would be pretty remarkable in its own right, given that the first year was not preceded by a major El Nino.
3 and 4 Year La Ninas
As I've reported in the past, the three-year and four-year La Ninas have given Dallas/Fort Worth the hottest summers on record for total 100-degree days:
1998 - 56, 1999 - 33 and 2000 - 46
2010 - 29, 2011 - 71, 2012 - 34 and 2013 - 28
We may be due for another blazing hot summer in North Texas.
Thank you for that…
Thank you for that information! We will hope that the heat will not be too extreme. The NMME models also seem to be favoring warmth for North Texas.
La Niña, 2022
Thanks for the insightful post on the ongoing La Niña, Michelle. And, thanks for continuing to monitor and write about ENSO.
Thank you for your support!
Thank you for your support!
Hello Michelle - I was…
Hello Michelle - I was reading an article about the connection of La Nina events to sea level and global earth temperature.
La Nina (2010/11) shifted ~1800km³ of precipitation from ocean to land areas, resulting in a temporarily lower GMSL (-5 mm) and global mean temperature (-0,32°F).
Wouldn't this "La Nina Effect" be a wonderful "watercooling" concept for humanity to lowering sea levels and Earth's temperature by actively retaining greater volumes of water (1000-2000km³) above land surfaces - also to counteract global water scarcity and desertification ?
interesting idea
That's an interesting idea! However, I am not sure how to sustain such a "La Nina Effect" in the face of the energy imbalance caused by increasing greenhouse gases. El Nino and La Nina cause large fluctuations in sea level and global mean temperature, but they do not cause long-term changes in the amount of energy entering and leaving earth's atmosphere. So, in the long run, they have no effect on the global temperatures or sea level.
Increasing greenhouse gases, on the other hand, cause an energy imbalance that continuously increases the ocean heat content (raising sea levels) and surface temperature. So, any long-term solution would need to oppose this energy imbalance or modify the carbon cycle substantially. I am not sure how such a geoengineering feat involving La Nina-like effects could do that, but I haven't thought about this that deeply.
3 Beans + my two cents
Really nice piece -- lively and well-written. Good example for science writers. Congrats
Severe gulf coast weather
"During La Niña, springtime severe weather can be more active in parts of the southern/southeastern United States (though not a guarantee..."
Looks like it happened this time, though, and only 11 days after this article was written!
As for us in the SW, we REALLY want this thing to end so we can have some water!
Yep, unfortunately this not…
Yep, unfortunately this not unusual for a La Nina spring. Hopefully the severe weather season won't be so severe, and we're all hoping for drought relief in the Southwest.
El/La...what's the diff in the NW?
Last two years, last four years, last 20 years... +avg temps (La Nin~a June '21? Forget hell heat that melted us?) and drought. Even on the coast. Winters? Mild, always it seems. (OK, brief cold spells that amount to a few days?) Snow pack in mountains is melting again and it's not even April.
I wish it was otherwise, but these ENSO's don't matter to me anymore. At least here in the Northwest.
Global Warming.
"permanent La Nina"
With the exception of summer 2012 and 2021, the Great Lakes region has been in a staggeringly wet and rather cool pattern for over 20 years. It's awful. We may be one of the few if not only region actually cooling in a supposedly warming planet overall. Ugh!
Great Lakes
It's true that parts of the Great Lakes region (as well as eastern Canada) have cooled over the past 20 years while most other regions have warmed. However, the temperature trends over 30+ years are positive over most of North America. Internal variability can overcome the effects of long-term warming over a couple of decades, but I would expect warming to win out on the longer term.
We are over it here in South East Australia
While we saw the cumulative effects of the last El Niño, with the devastating bush fires at the end of 2019, we certainly over the ongoing wet and more wet summers from this La Niña event. Some of the Northern New South Wales states are getting flooding again only weeks from the previous even, and others again from last summer. Definitely wanting the reversal to happen soon.
La Niña and Agriculture
Underwhelming harvests currently being collected in South America are being blamed on the La Niña weather pattern. Is there a strong correlation between La Niña and Agriculture, one way or the other?
I'm not sure of a specific…
I'm not sure of a specific paper that has looked at global agriculture and the ENSO cycle (somebody else feel free to jump in if they know of one). Having said that, I'd think that there should be some relationship, particularly in those parts of the world that have the stronger and more reliable precipitation signal. Of course, irrigation (at least for some regions) could help to muddle the relationship as well.
We had a nice guest post by…
We had a nice guest post by Weston Anderson that I recommend checking out:
https://www.climate.gov/news-features/blogs/enso/enso-climate-conductor-global-crop-yields
May wedding
I am getting married on May 14th (night of the waxing gibbous moon) on the North Shore of Oahu. May is the start of our dry season. February has been the lowest rainfall since 1927. My question is should I get a tent? We are having 150 guests on our tennis court and I would really like the view of the moon unencumbered by a tent.
Mahalo, Brynn
There's really no way to…
There's really no way to give a specific day forecasts 6 weeks in advance. My motto is always hope for the best, but prepare for the worst, which would entail renting the tent, then hoping you don't need to use it.
I'm getting married May 15th…
I'm getting married May 15th! And I am planning for rain or shine. :-)
!
I can't believe I'm hearing about this through the ENSO blog comment section! Congratulations!!
Mexico rains
I live in central Mexico and have an organic farm. We’ve been experiencing drought for years. But last year the rains were phenomenal. Perhaps it was the neutral pattern that alleviated the La Niña dryness? I have been praying for another season like 2021. So any prognosis of more La Niña makes me very nervous.
Mexico is interesting…
Mexico is interesting because the La Nina relationship with rainfall really depends on the time of the year. During the Northern Hemisphere summer, La Nina tends to favor wetter conditions and then it flips as it goes into the winter when La Nina tends to favor drier conditions. So fingers crossed you get a break from the dry conditions this summer! Here is what the NMME average of climate models predicts for JJA (June-August) right now, which seems more mixed. https://www.cpc.ncep.noaa.gov/products/NMME/current/usprate_Seas2.html
These forecast maps update each month at this webpage (prate is precip rate):https://www.cpc.ncep.noaa.gov/products/NMME/seasanom.shtml
Add new comment