Why ENSO forecasters shouldn’t just take their ball and go home during spring
This is a guest post by Dr. Aaron Levine who is a National Research Council postdoctoral associate at the NOAA Pacific Marine Environmental Laboratory. His research is on ENSO dynamics and predictability, and focuses on how changes in weather (or what is often referred to as “noise” in climate studies) influence the evolution of ENSO.
While you can’t set your watch to El Niño or La Niña because it occurs irregularly and sometimes with little warning, when one does emerge it is strongly linked to the calendar month. Typically, events peak during the Northern Hemisphere winter and then weaken or disappear during the spring or summer (1). In part because ENSO is transitioning, the spring is a difficult time to predict whether the upcoming winter will be El Niño, La Niña, or neutral conditions. This has been called the spring predictability barrier and like most barriers it presents additional challenges to get beyond. Currently, there is a hint of a forecast of a future El Niño but the barrier makes it difficult to be too confident in the predictions.
That makes this a nice time to review why we are able to predict ENSO at all and what aspects are particularly challenging to predict. Unlike weather prediction, where we rarely have to account for changes in the ocean, in ENSO prediction we have to forecast both the slower, more predictable changes in the tropical Pacific Ocean and the faster, less predictable movements of the atmosphere above it. At the risk of spoiling my punch line, during the spring, the starting conditions of the ocean provide less guidance than at other times of year and they are much less helpful for forecasting El Niño events than La Niña events.
Predicting La Niña: Cool down the Ocean
While the focus is often on El Niño, research has suggested that it’s sibling, La Niña, is more predictable than El Niño (2). To understand this, we turn to one theoretical basis for ENSO, the recharge oscillator. As discussed in this previous blog post, the recharge oscillator says warmer sea surface temperatures (SST) in the eastern Pacific Ocean along the equator weaken the winds and cause poleward movement of warm ocean water. This effect can be seen from the surface down to ~1000 feet below the surface of the ocean. As warmer ocean waters shift away from the equator, cooler water upwells from the deeper ocean, creating a deficit of Warm Water Volume on the equator and can trigger a La Niña event. Arguably, we saw this happen over the last year as we transitioned from a mammoth El Niño event to the weak La Niña conditions of the past several months.
Previous research indicates warm water volume at the equator precede SSTs by 6-9 months (3). From this one might think that warm water volume should be as good of a sign in predicting El Niño as La Niña. But the figure below tells us a different story. The horizontal x-axis shows that negative values of springtime warm water volume (numbers less than zero) are often related to La Niña-levels of cooling (blue dots) in the Niño-3.4 SST region, which is shown on the vertical y-axis. However, the opposite situation is not as true: positive anomalies in warm water volume do not confidently result in an El Niño event (red dots).
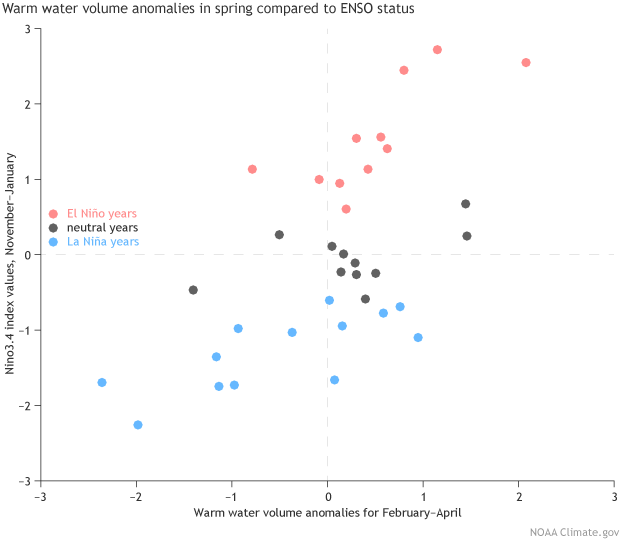
The Warm Water Volume anomaly during February-April compared against Niño-3.4 sea surface temperature (SST) during the following November-January. The La Niña years are colored in blue, the El Niño years in red, and ENSO-Neutral years in black. Large negative values of Warm Water Volume anomalies almost always lead to a La Niña event. However, large positive Warm Water Volume anomalies do not lead to El El Niño events. For SST data, OISST is used. Warm Water Volume comes from the PMEL analysis (http://www.pmel.noaa.gov/elnino/upper-ocean-heat-content-and-enso). Figure provided by Aaron Levine and modified by Climate.gov.
Predicting El Niño: Warm up the Ocean and Turn On the Noise
So, what makes warm water volume a worse indicator for El Niño events than La Niña events? Simply put, plain old weather over the equatorial Pacific Ocean greatly complicates the picture.
To understand how the weather impacts ENSO, let’s start by thinking about what happens when we blow across a pan of hot water. First, the water cools where we are blowing. Second, the water stacks up on the side of the pan opposite of where we are blowing.
Now to apply this to the tropical Pacific Ocean, where the winds normally blow from east to west, which piles up warm water in the western Pacific (see normal/neutral conditions of the Walker circulation here). Prior to the possible onset of El Niño, we want to see whether the normal winds weaken—a westerly anomaly—and not all at once, but in a series of successive pulses. If strong enough, these Westerly Wind Bursts can simultaneously cool the waters in the extreme western Pacific and allow the warm waters in the western Pacific to slide east. The increase in warm water volume that accompanies these westerly wind bursts can increase the potential for, but not guarantee, an El Niño event.
In fact, expansion of the warm surface waters to the eastern Pacific can also create conditions where more westerly wind bursts will occur! A westerly wind burst makes a second one more likely to occur than the original one (scientists call this “state-dependent noise forcing,” a term that would make you the most popular guest at your next dinner party (4)). This Weather Noise (a measure of winds- for more details see the Methodology section below) results in a larger range of possible outcomes that depends on what happens during the spring and summer months. For example, the ENSO evolution in spring and summer of 2014 was very different from that of 2015 despite very similar starting conditions in the ocean.


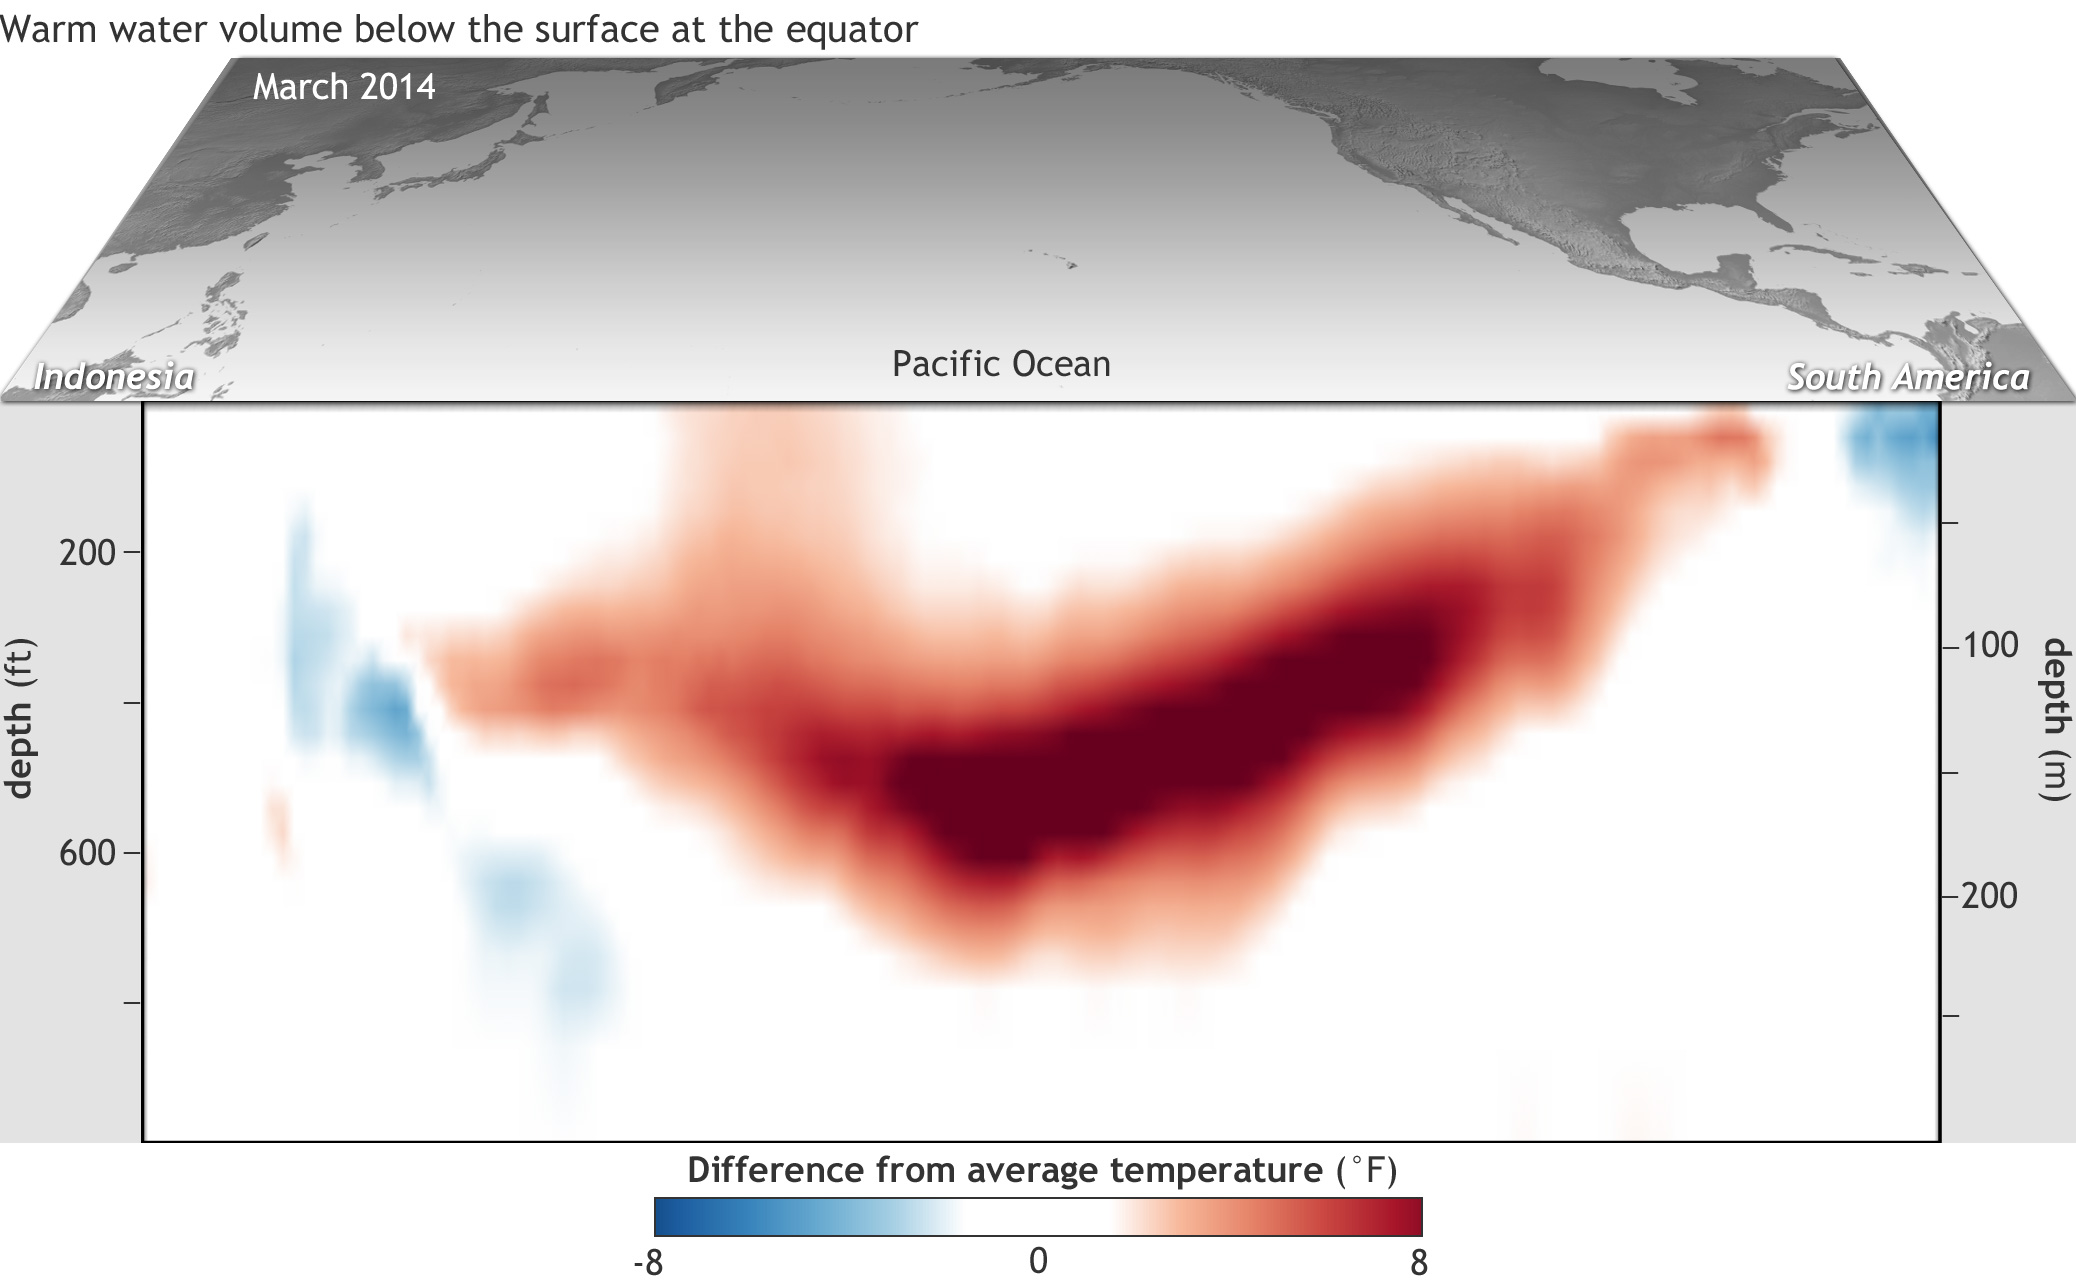
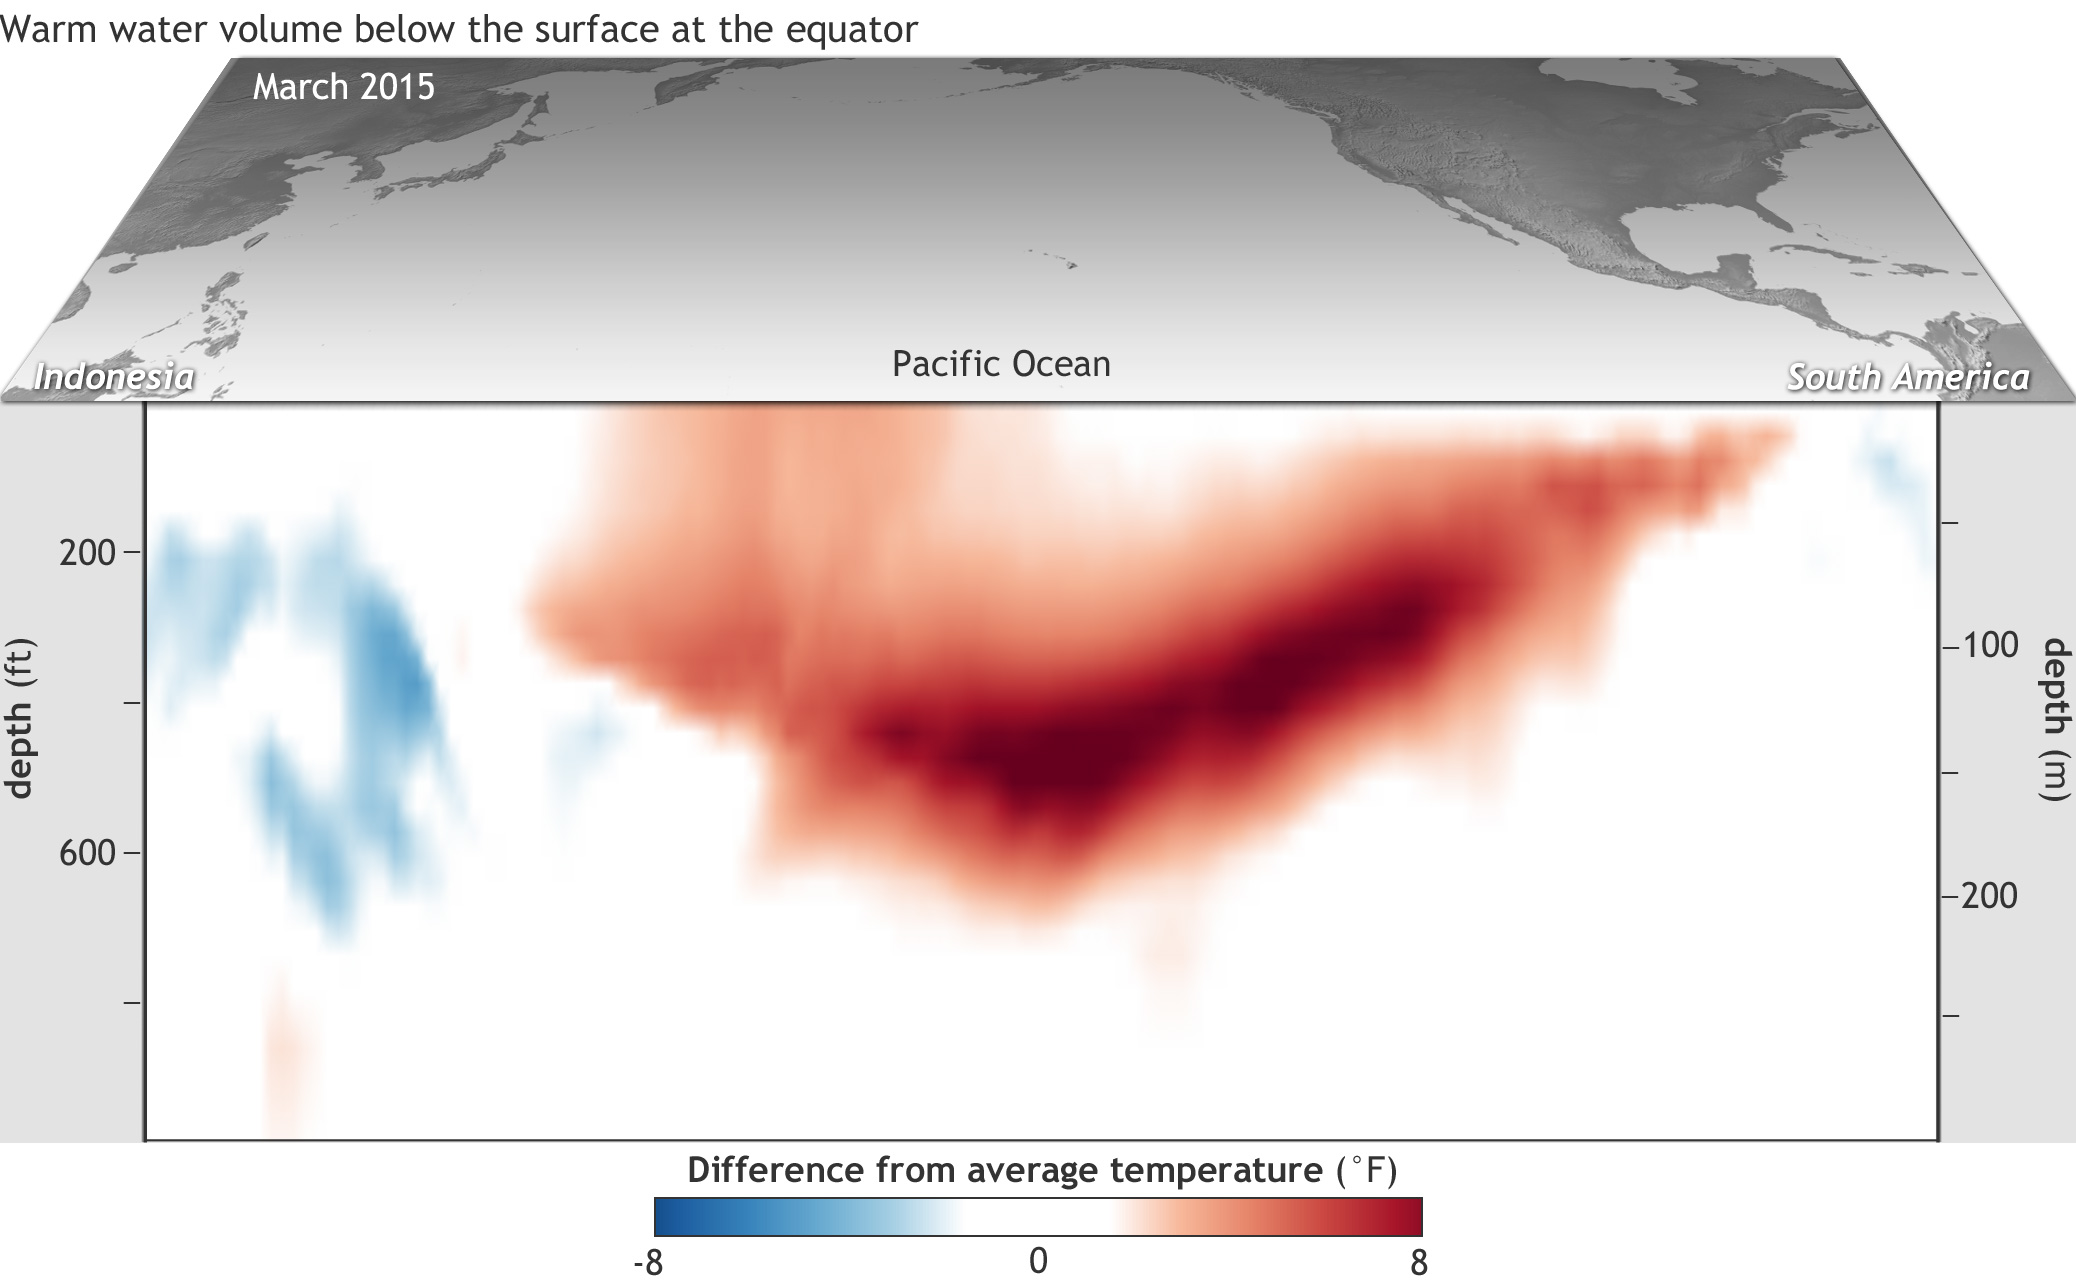
Grab and drag the slider to compare the similarities between subsurface (top 300 meters of the ocean) warm water volume in spring 2014 (left) and 2015 (right). Despite the similarities, 2014's impressive warm anomaly failed to evolve into El Niño, while 2015's slightly smaller anomaly did. NOAA Climate.gov images based on Climate Prediction Center data. large versions 2014 | 2015
The figure below shows that the influence of weather noise over the March-October time period is very important to the development of El Niño events (red dots). In particular, notice how the red dots cluster on the positive side of the weather noise. This means one needs to see more westerly winds in order to obtain El Niño during the upcoming winter. If there are more easterly winds during March-October (negative values of weather noise), then El Niño does not historically develop regardless of whether there is a deep pool of warm water beneath the surface. On the other hand, the La Niña events (blue dots) occur as often with positive weather noise as negative weather noise.

The Weather Noise forcing from March-October compared against Niño-3.4 sea surface temperature (SST) during the following November-January. The weather noise forcing is an important part of El Niño events, but it is not that important of a component for any other year. The weather noise is calculated from GODAS zonal wind stress using the formula for τR from Levine and Jin 2017. Figure provided by Aaron Levine and modified by Climate.gov.
So, the existence of a large volume of warm water below the surface in the spring isn’t, by itself, a reliable predictor the El Niño will develop because the atmosphere has to help out by relaxing the prevailing winds; and when or if those westerly wind bursts will happen isn’t predictable months in advance.
But why isn’t the same true for La Niña? To a large extent, that takes us back to the recharge oscillator theory mentioned above (and that Michelle blogged about before). According to that theory, as warm surface water from a decaying El Niño drains north and south away from the equator cold water from deeper in the ocean wells up to replace it. These siphoning currents—outflow followed by upwelling—create a strong momentum toward La Niña that is hard to interrupt. That momentum makes weather noise less significant, and it makes deficits of warm water volume in the spring a more reliable predictor that La Niña will develop.
All of that is great, but what does it say about the upcoming winter?
As discussed in Emily’s most recent post, some model predictions indicate an El Niño event may happen this coming winter. Let’s evaluate these simple ideas in light of that prediction. Currently, the warm water volume anomaly is nearly zero and the SST anomaly is increasing (becoming less negative). With spring time warm water volume anomalies near zero, we can more confidently state there is a smaller likelihood of a La Niña event happening. But, to be even more confident in a possible El Niño, we need to watch carefully what happens with the weather over the tropical Pacific during the spring and even into the summer. The upcoming months will be telling.
What we covered here is a simple framework, but these ideas help reinforce and give a physical basis for what the more complex seasonal climate forecast models are telling us. It is always comforting when the forecasts fit well with our understanding of ENSO predictability. And if (and when!) they don't align, we see that as an opportunity to better our understanding of ENSO and improve our prediction models.
Lead reviewer: Michelle L’Heureux, NOAA CPC
Methodology
Warm Water Volume is the volume of water with a temperature greater than 20°C in the box bordered by 120°E and 80°W and 5°S and 5°N. It is measured in units of 1015 cubic meters. The values used here are downloaded from http://www.pmel.noaa.gov/elnino/upper-ocean-heat-content-and-enso. The challenge with calculating the weather noise is separating what is weather from the impact of El Niño on the Southern Oscillation. We remove the direct impact of El Niño SST anomalies (5) on the monthly mean zonal wind stress used to force GODAS following the method outlined by Levine and Jin (2017). The residual wind stress variability is defined as the weather noise.
Footnotes/References
(1) Stein, K., N. Schneider, A. Timmermann, and F.-F. Jin, 2010: Seasonal synchronization of ENSO events in a linear stochastic model. J. Climate, 23, 5629–5643, doi:10.1175/2010JCLI3292.1.
Stein, K., A. Timmermann, N. Schneider, F.-F. Jin, and M. F. Stuecker 2014: ENSO seasonal synchronization theory, J. Climate, 27(2014), 5285–5310.
(2) Kessler, W. S. 2002: Is ENSO a cycle or a series of events?, Geophys. Res. Lett., 29(23), 2125, doi:10.1029/2002GL015924.
Larson, S. M., & Kirtman, B. P. 2016: Drivers of coupled model ENSO error dynamics and the spring predictability barrier. Climate Dynamics, 1-14. doi:10.1007/s00382-016-3290-5
Dommenget, D., T. Bayr, and C. Frauen 2013: Analysis of the non-linearity in the pattern and time evolution of El Niño Southern Oscillation, Clim. Dyn., 40(11–12), 2825–2847.
(3) Meinen, C. S., and M. J. McPhaden, 2000: Observations of warm water volume changes in the equatorial Pacific and their relationship to El Niño and La Niña. J. Climate, 13, 3551–3559, doi:10.1175/1520-0442(2000)013,3551:OOWWVC.2.0.CO;2.
McPhaden, M. J. 2012: A 21st century shift in the relationship between ENSO SST and warm water volume anomalies, Geophys. Res. Lett., 39, L09706, doi:10.1029/2012GL051826.
(4) Eisenman, I., L. Yu, and E. Tziperman, 2005: Westerly wind bursts: ENSO’s tail rather than the dog? J. Climate, 18, 5224–5238, doi:10.1175/JCLI3588.1.
Lengaigne,M., E.Guilyardi, J. P. Boulanger, C.Menkes, P. Delecluse, P. Inness, J. Cole, and J. Slingo, 2004: Triggering El Niño by westerly wind events in a coupled general circulation model. Climate Dyn., 23, 601–620, doi:10.1007/s00382-004-0457-2.
Levine, A. F. Z., F. F. Jin and M. J. McPhaden 2016: Super Noise-Super El Niño: How Stochastic Forcing Creates Extreme El Niño events. J. Climate. 29, 54833-5499. Doi: 10.1175/JCLI-D-16-0091.1.
Philip, S. and G. van Oldenborgh, 2009: Significant Atmospheric Nonlinearities in the ENSO Cycle. J. Climate, 22, 4014–4028, doi: 10.1175/2009JCLI2716.1.
(5) We use multiple regression analysis to define the expected zonal wind anomaly for a given SST anomaly and time of year, removing four different ways that the SST anomalies and time of year have been previously shown to impact wind stress anomalies.
Other references
Burgers, G., F.-F. Jin, and G. J. van Oldenborgh (2005), The simplest ENSO recharge oscillator, Geophys. Res. Lett., 32, 13706, doi:10.1029/2005GL022951.
Levine, A. F. Z. and M. J. McPhaden, 2015: The annual cycle in ENSO growth rate as a cause of the spring predictability barrier. Geophys. Res. Lett., 42, 5034–5041, doi:10.1002/2015GL064309.
Levine, A. F. Z and F. F. Jin 2017: A simple approach to quantifying the noise-ENSO Interaction. Part I: Deducing the state-dependency of the windstress forcing using monthly mean data. Clim. Dyn. 48, 1-18. DOI 10.1007/s00382-015-2748-1.
Comments
El Nino La Nina predictions
Sub surface regions
How about some plain English and less fuzzy predicting?
Great Article
Add new comment