Your eight-minute speed date with the Pacific Meridional Mode
This is a guest post by Prof. Daniel J. Vimont (@DanVimont) of the University of Wisconsin Center for Climatic Research. His group focuses on mechanisms of climate variability and change, the intersection between weather and climate, and global and regional impacts of climate change. Apparently, he also likes to fly fish.
One of the things that climate scientists (not to mention disgruntled California residents who had been hoping for a drought-buster) can’t stop talking about is how the strong El Niño of 2015-16 just didn’t act like previous El Niños in many respects. Part of that discussion involves other climate patterns that operate in the Pacific Ocean and how they work to enhance or hold back ENSO. In that vein, let me introduce you to Pacific Meridional Mode (PMM).
If we’re going to keep with the earlier theme of speed dating our way through various patterns of climate variability (betcha can’t wait ‘till your eight minutes with “The Blob”), then our next partner is the PMM and its interactions with ENSO. And, if you want, you can grab the section headers for your next blind date.
So, where are you from?
There are actually two meridional modes, one in the Atlantic and one in the Pacific. Early work (2) focused on the connection between climate variability in the tropical Atlantic and rainfall in Brazil (see below; bottom right corner). Scientists noticed that reduced precipitation in the Nordeste region during Northern Hemisphere spring was associated with increased sea surface temperature (SST) in the northern tropical Atlantic and reduced SST in the southern tropical Atlantic. These temperature fluctuations are accompanied by anomalous near-surface winds that blow toward the warmer hemisphere, and precipitation shifts northward from its typical position.
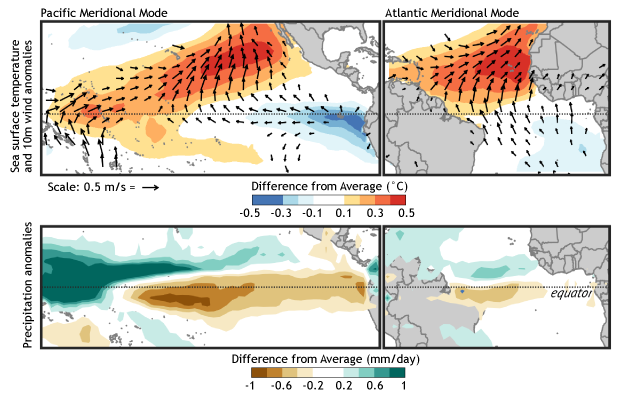
Fig. 1: Tropical patterns associated with the positive state of the Pacific (left) and Atlantic (right) Meridional Modes. The top panels show SST anomalies (shading) and near-surface wind anomalies (vectors), and the bottom panels show precipitation changes. Red (green) shading indicates above-average SST (precipitation) and blue (brown) shading indicates below-average SST (precipitation). Figures based on Chiang and Vimont (2004) and modified by Climate.gov.
The phrase “meridional mode” came about in the 1990s to distinguish these kinds of variations from the more zonal ENSO variability (1). ENSO tends to be characterized by variations and evolution in the east-west (zonal) direction, while meridional modes tend to involve variations in the north-south (meridional) direction – hence the term “meridional”. And, the term “mode” just refers to coherent interactions between the ocean and atmosphere.
Well that explains your sibling in the Atlantic, but how did you end up here?
Identification of the meridional mode in the Pacific happened somewhat serendipitously. One day as I was finishing my Ph.D. in the early 2000’s, John Chiang came into my office and mentioned that what I was studying in the Pacific seemed to have a lot of similarities to the dominant pattern of climate variability in the Atlantic. It was a simple comment that hadn’t really registered to me before, but it had important implications: if the same pattern of variability occurred in the Pacific and the Atlantic, then it’s probably something that is fundamental to the tropical ocean / atmosphere system.
Together, we began to explore this possibility using observational analysis and model simulations, and wrote a manuscript calling attention to “Analogous Pacific and Atlantic meridional modes of ocean-atmosphere variability”. Evidently we both felt pretty highly of the other author’s contribution, because when it came time to decide on the order of authorship, we both argued that the other should be listed first. In the end, we flipped a coin. I won, so John is first author.
Tell me about yourself. What makes you tick?
Meridional modes evolve via a very different set of ocean/atmosphere interactions than ENSO. While ENSO relies on the interplay between the surface and the sub-surface conditions in the equatorial ocean, meridional modes instead rely on the interplay between wind speed and surface evaporation, the so-called “Wind-Evaporation-SST” or WES feedback.
The Pacific Meridional Mode evolves from warm subtropical SST anomalies (the warm band extending south-westward from Baja California in the figure above). These SST anomalies cause the trade winds to relax (i.e., weaken) in such a way that evaporation is also reduced over and to the southwest of already-warm SST anomalies. This reduction in evaporation tends to further expand the warmer waters southwestward, toward the equator, intensifying the meridional mode.
While interesting on its own, in the Pacific this sequence of events can reduce the trade wind anomalies along the equator. We care, because those relaxed trade winds along the equator can help initiate or intensify an El Niño event (the reverse polarity would influence La Niña). More on that in a minute.
Describe someone who has had a strong influence on you.
Unlike ENSO, it turns out that the PMM is pretty chill: it takes a lot to get it all riled up. But, if there’s one character in the Pacific that can ruffle its feathers, it’s that darned North Pacific Oscillation.
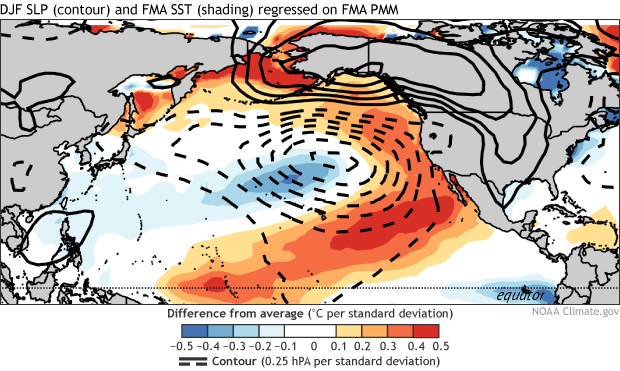
Fig. 2: Early spring (February-April) sea surface temperature and winter (December- February) atmospheric circulation anomalies related to the positive state of the Pacific Merdional Mode during early spring. Dashed black contours reflect lower-than-average sea level pressure and solid black contours indicate higher-than-average sea level pressure. Anomalous low-level winds flow counter-clockwise approximately paralleling the dashed contours, while flowing clockwise nearly paralleling the solid contours. Red shading indicates above-average sea surface temperature and blue shading reflects below-average sea surface temperature. Figure provided by Dan Vimont and modified by Climate.gov.
The what? Let’s explain. In the Pacific, the initial surface temperature anomaly associated with the PMM tends to be generated by a weakening of a semi-permanent high pressure zone that occupies the subtropical Pacific during the Northern Hemisphere winter. The weakening of the high reduces the trade wind strength. The relaxation of the trade winds is strongly related to a basin-wide sea-level pressure pattern called the atmospheric “North Pacific Oscillation” (see above). Thus, the PMM links the mid-latitude atmospheric circulation to the equator, and the initiation and development of ENSO (2). More recent research has pointed out that this sequence of events tends to have a strong connection with the development of ENSO events that are stronger in the Central Pacific.
OK, let’s get serious. Tell me about your most recent relationship.
So, to summarize so far: As the PMM’s SST structure evolves, it can cause a relaxation of the trade winds along its southwestern flank. If the pattern expands close enough to the equator, those relaxed trade winds can trigger, or support the development of an El Niño event, particularly in the Central Pacific.
While this isn’t always the case, this process does seem to have occurred during 2014, helping plant the seeds for the 2015 event. In late 2014 and early 2015 the PMM reached record high values and was associated with warm SST anomalies in the central equatorial Pacific (see figures below). These persistent warm anomalies near the International Date Line marked the beginning of the 2015-16 El Niño event – in fact, one could argue the above average SSTs during the 2014-15 winter should be called a PMM event.
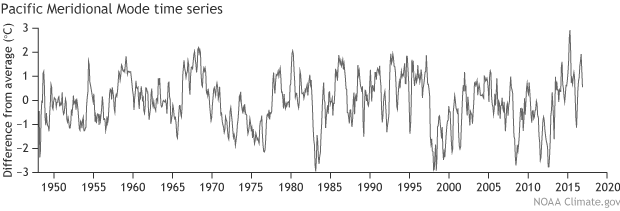
Fig. 3: Time series of the Pacific Meridional Mode. Positive values are related to the positive state of the Pacific Merdional Mode (related patterns are shown in the previous figures). Figure provided by Dan Vimont (index updated here: http://www.aos.wisc.edu/~dvimo
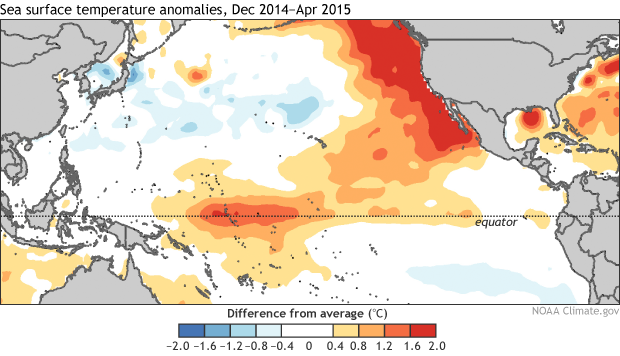
Fig. 4: Sea surface temperature anomalies during December-February, 2015. Red shading indicates above-average sea surface temperature and blue shading reflects below-average sea surface temperature. Data is from NOAA ESRL PSD’s Plotting and Analysis Page and is based on NOAA Optimal Interpolated SST (OISST). Figure created by Dan Vimont and modified by Climate.gov.
The following 2015-16 El Niño event was unique among strong El Niños in that the PMM was exceptionally strong and positive (i.e. warm anomalies in the subtropics) prior to the event and has persisted more or less throughout and following the event. During the previous two extreme El Niño events (1982-83 and 1997-98), the meridional mode flipped into a strong negative phase as the event reached peak intensity (see time series above). This was especially true of the 1997-1998 El Niño, which was followed by persistent cold conditions and extreme negative PMM values for a few years afterwards.
But, mysteriously, the PMM has not really shifted into a negative phase after the 2015-16 El Niño, and in fact has been moderate to strongly positive over the last few months. While we can’t perfectly quantify the PMM’s role in the evolution of the 2015-16 El Niño, its extreme positive values are consistent with the subsequent strong El Niño. Their persistence through the peak of the event, however, is not.
What’s next for us?
What does this positive PMM mean for the currently borderline, weak La Niña? It’s tough to know. While research shows a relationship between the PMM and ENSO, there’s a lot of competitors for ENSO’s attention in the Pacific, and the 2015-16 ENSO event has been a strange one for a lot of reasons, the ongoing positive PMM values included. Positive PMM values tend to precede El Niño events, so the current PMM conditions would be consistent with a weakening La Niña forecast. BUT, I’ll caution that there is a lot of other competitors for ENSO’s attention in the Pacific, so at this point it’s tough to attribute such a forecast to the PMM.
Well, it was nice getting to know you, PMM, and we hope you recover from your recent relationship with ENSO (it seems like you’ve had a hard time letting go). And for readers, if this piqued your interest you can keep up with the current PMM happenings on the “Meridional Modes” website at http://www.aos.wisc.edu/~dvimont/MModes/PMM.html, which gets updated early each month.
Now, who’s up next?
Lead reviewer: Michelle L’Heureux, CPC
Footnotes:
(1) Although subsequent work in the 1990’s diagnosed the dynamics of this pattern of variability in the Atlantic from a variety of approaches, the wily Atlantic Meridional Mode turned out to be a bit more difficult to pin down than its friend in the Pacific, the straight-laced El Niño. In particular, there was considerable debate in the scientific community as to whether such patterns of variability constituted a true “mode” of climate variability (like ENSO was thought to be), or simply a consistent set of climatic conditions (much like geostrophic balance implies a consistent relationship between winds and horizontal pressure variations). At that time, the Atlantic Meridional Mode was referred to as the Atlantic Dipole mode, the Interhemispheric mode, the Equatorial Gradient Mode, or simply Tropical Atlantic Variability. Indeed, in the early 2000’s when we (following the terminology used in Servain et al. 1999) used the phrase “Meridional Mode” in a scientific conference, Stefan Hastenrath pointedly (and in good nature) commented: “That’s great! I’ve been studying this for thirty years and never knew its name.”
(2) Contrast this with the well-known response of the mid-latitude atmosphere to an evolving ENSO event
References:
Chiang, J., & Vimont, D. (2004). Analogous Pacific and Atlantic Meridional Modes of Tropical Atmosphere-Ocean Variability. Journal of Climate, 17, 4143–4158. http://journals.ametsoc.org/doi/abs/10.1175/JCLI4953.1
Servain, J., I. Wainer, J. P. McCreary, and A. Dessier (1999), Relationship between the equatorial and meridional modes of climatic variability in the tropical Atlantic, Geophys. Res. Lett., 26, 485–488. http://onlinelibrary.wiley.com/doi/10.1029/1999GL900014/abstract
Comments
PMM
My Speed date
RE: My Speed date
There is no connection made to the condition of Arctic Sea Ice in this piece. Perhaps the Arctic Sea Ice reduction is a little too far removed to the north to have an obvious influence on the PMM phenomenon, although on this globe there seems to be connections to some degree between nearly any two phenomena. Although only a guess, I would tend to think that PMM would still be doing its thing even with much reduced Arctic Sea Ice.
Shifting water column weights
Add new comment