S(no)w pain, S(no)w gain: How does El Niño affect snowfall over North America?
Note: The primary writer of this post is Michelle L’Heureux, but it is inspired by and reviewed by Brian Brettschneider, who is the NWS Climate Service Program manager for the Alaska region.
The last several winters have been depressingly bleak for snow lovers in the Washington, D.C. area, where we at the Climate Prediction Center (CPC) are located. Needless to say, when Brian Brettschneider (@Climatologist49) showed me that the D.C. area historically sees above-average snowfall during El Niño winters, I excitedly dusted off our sleds and ordered new mittens because we’re expecting an El Niño this winter 2023–24. With that said, longtime ENSO blog readers will know that I’m wish-casting a bit and there’s S(no)w guarantee in this business! [And, yes, this blog post will include a painful number of snow puns]. El Niño nudges the odds in favor of certain climate outcomes, but never ensures them. There have been some D.C. area snow droughts during past El Niño winters, and climate change is not our friend.
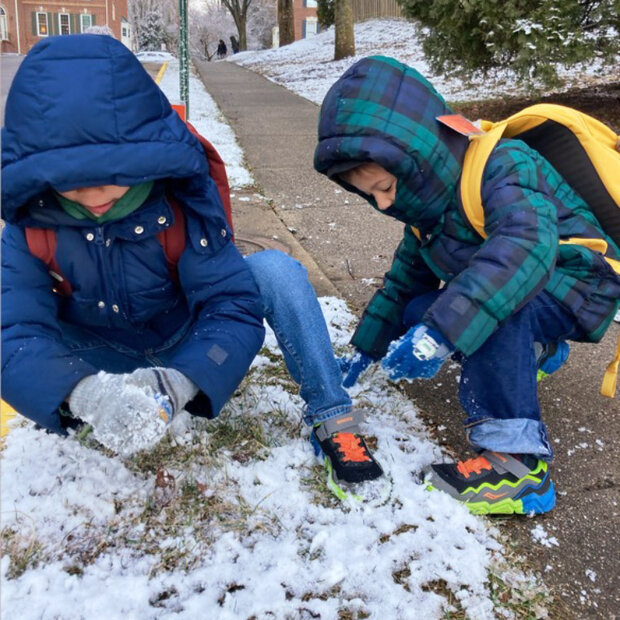
Sad children trying to scrape together enough snow to make a snowball in the D.C. area last winter. Even worse, they didn’t get a snow day. Photo credit: Michelle L’Heureux.
My next question to Brian was “What exactly is this snowfall dataset you are using?” As Deke Arndt (NCEI) has noted, collecting historical measurements of snow is a tricky endeavor, fraught with measurement errors, so creating a dataset of sufficient quality for climate studies is hard. But, Brian, who is a clever, outside-the-box thinker, realized that the new ECMWF ERA5 reanalysis dataset may be the ticket (footnote #1). About five years ago, my colleague at CPC, Stephen Baxter, published this wildly popular blog post on snow and La Niña winters. The only problem is the dataset he used stopped updating in 2009. Thus, we’ve been adrift, snow-wise, until Brian pointed us to this new snowfall analysis. So, what does it look like?
S(no)w wonder
Who are the snowfall winners (or losers) during El Niño? As Emily shared with us last month, the jet stream tends to extend eastward and shift southward during El Niño winters. You can think of the jet stream as a river of air, which carries more moisture and precipitation along the southern tier of the United States during El Niño. As a result, it is not surprising to see a stripe of increased snowfall (blue shading) over the southern half of the country. Obviously, snowfall is limited in its southernmost reaches because it needs to be cold enough to snow, so the effects are strongest in the higher and colder elevations of the West. To the north, however, there is a reduction in snowfall (brown shading), especially around the Great Lakes, interior New England, the northern Rockies and Pacific Northwest, extending through far western Canada, and over most of Alaska. In fact, El Niño appears to be the great snowfall suppressor over most of North America.
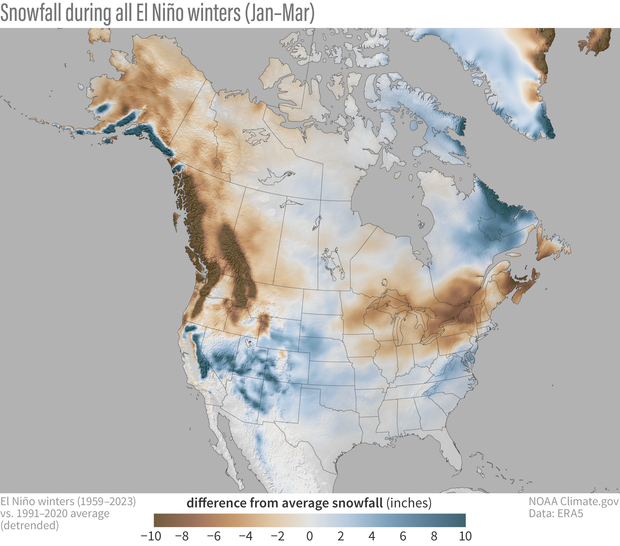
Snowfall during all El Niño winters (January-March) compared to the 1991-2020 average (after the long-term trend has been removed). Blue colors show more snow than average; brown shows less snow than average. NOAA Climate.gov map, based on ERA5 data from 1959-2023 analyzed by Michelle L'Heureux.
How about snowfall during moderate-to-strong El Niño events like the one expected in winter 2023-24? In the map below, over many regions, the anomalies become stronger (anomaly = difference from the long-term average), which makes sense because El Niño affects the climate. Stronger El Niño events tend to land a larger punch on our atmosphere, thus increasing the chance of seeing expected El Niño impacts.
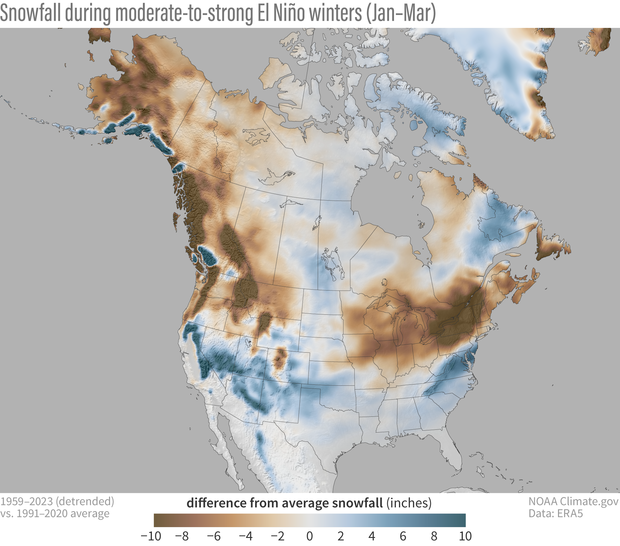
Snowfall during moderate-to-strong El Niño winters (January-March) compared to the 1991-2020 average (after the long-term trend has been removed). Blue colors show more snow than average; brown shows less snow than average. NOAA Climate.gov map, based on ERA5 data from 1959-2023 analyzed by Michelle L'Heureux.
Snow is flakey
While the maps we’ve shown above may excite or depress you depending on your situation and snow preferences, it is very important to recognize that the map is the showing the average of all winters with El Niño (footnote #2). Relying on the average is a bit dangerous because a few heavy snowfall winters can give the impression that most winters are above average. Which is why it’s important to recognize there can be large variation from winter-to-winter.
Below is a map showing a count of El Niño winters: Here, we ask how many of the 13 moderate-to-strong El Niño winters had below-average snowfall? If it is in red shading, that means most winters had below-average snowfall. The deepest reds mean almost all past winters had below-average snowfall (black indicates no snowfall at all, which makes sense if you’re sitting on a beach in South Florida). If it is in grey shading, that means most moderate-to-strong winters had above-average snowfall.
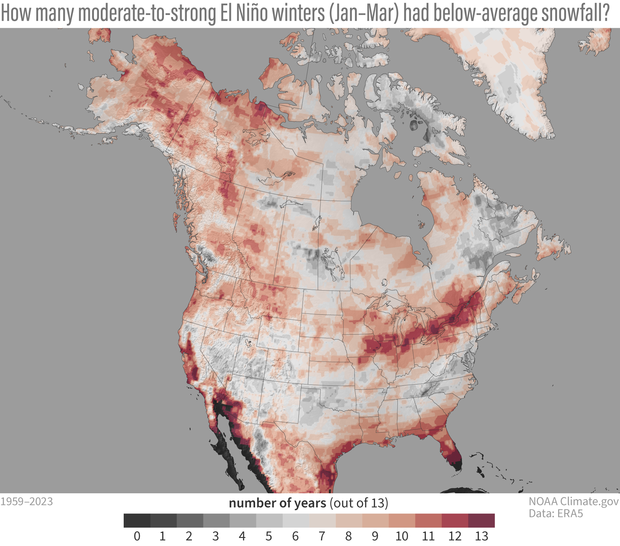
Number of years with below-average snowfall during the 13 moderate-to-strong El Niño winters (January-March average) since 1959. Red shows locations where more than half the years had below-average snowfall; gray areas below-average snowfall less than half the time. NOAA Climate.gov map, based on ERA5 data from 1959-2023 analyzed by Michelle L'Heureux.
S(no)w win situation
Another major caveat related to these maps is they are just based on snowfall during El Niño, and I have removed long-term trends. There is also a trend in snowfall, and it looks like this over North America during January-March.
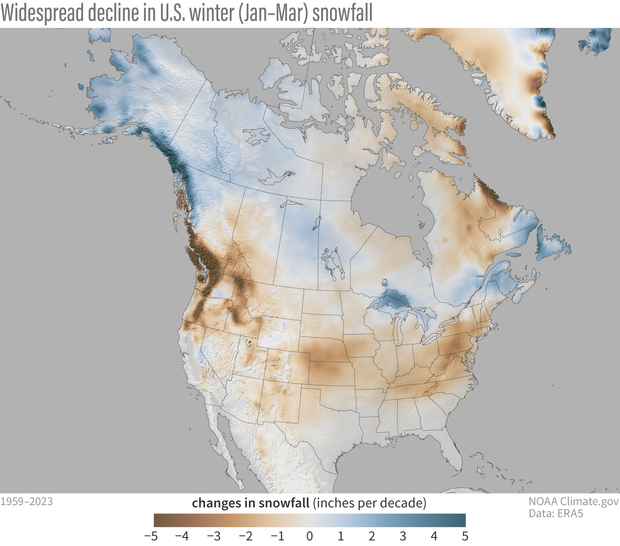
Changes in snowfall (in inches per decade) between 1959 and 2023. Across most of the United States—Alaska being the major exception—snowfall has declined (brown colors). NOAA Climate.gov map, based on ERA5 data from 1959-2023 analyzed by Michelle L'Heureux.
Unsurprisingly, because of climate change, over most of the contiguous United States we have trended toward less snowy winters. This doesn’t mean that it never snows, or we cannot get big snowstorms (footnote #3), but that snowfall has gradually trended downward over time. In contrast, wintertime snowfall may have actually increased somewhat over time over the colder northern latitudes of Alaska and parts of Canada (this trend reverses in the spring; see footnote #4). Why would that be the case? Well, if you think about it, the warming of our planet allows the air to hold more moisture. If the atmospheric circulation allows for it, then that moisture can be wrung out of the air and precipitate. Snowfall also depends on the air temperature remaining below the freezing point. At more northern latitudes, despite warming air temperatures, it still remains cold enough in the winter to fall as snow. But there is no such luck in more southern locations which are often closer to the freezing point. There, the tendency toward warmer winters is a snow killer.
So, will the expected pattern of El Ni-S(ño)W pan out for us this winter? Time will tell, but in the meantime, it is fun to imagine the possibilities.
Footnotes
(1) We have to be careful to not take any one dataset literally, but this ECMWF ERA5 data seems to pass a few sniff tests. Sniff test #1 was “Does ERA5 snowfall reproduce the winter pattern of snowfall made with other datasets?” The answer, at least when comparing with winter 2022-23, is yes. Sniff test #2 was “Does ERA5 snowfall reproduce the historical ENSO pattern that is found within other datasets?” Here again, the answer is yes, we were able to reproduce ENSO composite maps that were made with the Rutgers gridded snow data in this older ENSO blog post. Sniff test #3 was comparing with our old ENSO snowfall composites made from an even older (not quality controlled) station-based dataset that has been discontinued. With that said, ERA5 is a newer dataset, it is “reanalysis,” which means that a very short-range weather model is used to produce snowfall from in situ observations (from the ECMWF website, it outputs the “mass of snow that has fallen to the earth’s surface”). Essentially a reanalysis is predicting what observed snowfall would have looked like based on past observational inputs from satellites, stations, buoys, and other observing systems. Therefore, we recommend you treat some of the finer details with a healthy degree of suspicion and try to corroborate them in other datasets. Hopefully this blog post will motivate the creation of additional snowfall datasets and scientists will explore how well ERA5 compares with these other snowfall measurements.
(2) Brian emphasizes that composites (average historical maps during El Niño) are retrospectives and they are not a forecast. A forecast takes in account conditions beyond just El Niño, such as long-term climate trends, soil moisture, sea ice, and other global boundary forcings.
(3) In fact, because a warmer atmosphere carries more moisture, there is published evidence that extreme snowfall events can intensify as a response to global warming (e.g. O’Gorman, P., 2014: Contrasting responses of mean and extreme snowfall to climate change. Nature, 512, 416–418).
(4) This pattern of snow trends drastically changes if you look at the shoulder seasons, say April-June, which is warmer even in those northern latitudes. Rebecca took a look at this in this climate.gov article on spring snow cover in the Northern Hemisphere. In this season, trends are toward less snow cover over Alaska and western Canada. The ERA5 snowfall trends in April-June also reproduce the same features.
Comments
There is no statistically…
There is no statistically significant difference in DCA's season-total snowfall between +ENSO states.
So, one thing I would…
So, one thing I would caution folks is to not compare this dataset to point-based "man measuring with a ruler" type measurements. This is a different quantity (snowfall toward Earth's surface) and therefore not subjected to influence from pavement, canopy, surface winds, etc. which tend to reduce amounts actually measured at the surface. Overall the pattern and strength of the relationship is consistent with what we find in other datasets (see footnote #1).
I should add that the counts map also tends to suggest there is a slight lean among the 13 El Ninos, but it is not strong in the DC area. It won't stop me from wishing for more snow this winter though!
El Niño storm tracks
THANKS for this article. As a forecaster who spent 4 decades tracking the dreaded rain-snow line along I-95, DC,PHL and NYC your maps show the wide ranges of El Niño conditions, from very quite 4am-shift cross-country ski trip to work down NYC's 5th Ave, to two-hands-on blown-out umbrellas with raging rain.
While in the West the effect of El Nino's change in the subtropical storm track steers Pacific moisture further south. In the East the GALE Experiment Design Panel, chaired by my former UW Prof. Peter Hobbs, of the mid-1980s investigated the many factors of East Coast snow storm development. https://doi.org/10.1175/1520-The wide range of meteorological and oceanographic phenomena are numerous, including: 1. cyclogenesis, 2. rainbands, 3. cold fronts, 4. coastal fronts, 5. cold-air damming, 6. jet streaks, 6. tropopause folding, 7. low-level jets, 8. cold-air outbreaks, 9. lightning and 10. Gulf Stream.
It is a 4-dimensional Chinese jig-saw puzzle for sure.
thank you
Thank you for sharing this, Joe. As a current and long-time resident of central New Jersey, I'm no stranger to that dreaded rain-snow line whenever a potential major snowstorm is brewing.
Tropopause folding
What is tropopause folding? And, what does it have to do with storm formation?
I had never heard about it until I read your comment, so I'm curious.
maps
It would take an MIT scientist to figure out these maps. I'll go back to just looking out the window daily during the winter.
Talk about making a mountain out of a molehill!
Agree lf
Speak simply ...
Lol it's not that hard…
Lol it's not that hard.
Interesting and amusing post…
Interesting and amusing post. Thanks!
But I'd add that the color scheme or the key seem to have a difficulty. Much of the maps look white, but no white appears on the key. (As reproduced on my screen anyhow.)
That is most obvious on the number of years graph, where I'll guess white might be 7 years??
The number of years map does…
The number of years map does have some pale shades in the middle--6 years is a very pale gray, with 7 years a pale pink. It's hard to see on my monitor, too!
MIT Scientist
Meteorologists are great at making mountains out of molehills! I would be willing to bet that not even an MIT Scientist could figure out the weather. "A meteorologist is the only job you can be wrong 99.99% of the time and still keep your job!" As they keep repeating in their article it's allll "PREDICTIONS"! I agree with you, the only 100% percent accurate forecast is day to day looking out the window or stepping outside to see if it's cold or hot.
El Nino Winter in MN is a fantasy
Nov 4 Fr Minnesota
We read all the data and warm weather charts
El Niño winter means nothing here. There is no such effect.
We always have the cold northern winds from the Canadian prairies and effects fr arctic and north territories and being a cold weather state is a barrier to any El Niño.
Talking Snow not Temps
Article is about snowfall...not temps.
El Niño + sudden stratospheric warming
What are the odds of a sudden stratospheric warming event during an El Niño winter? It seems like one of those happening would increase the odds of measurable snowfall across most of the U.S. (depending, of course, on when it happened).
Good question! I'll quote…
Good question! I'll quote Amy Butler's ENSO blog post on this very subject:
El Niño, with its modified planetary waves, tends to promote the breakdown of the polar vortex, especially in late winter, which in turn modifies the atmospheric circulation pattern associated with the El Niño.
All the details here: https://www.climate.gov/news-features/blogs/enso/el-niño-and-stratospheric-polar-vortex
Amy Butler post
I just read the post that you included a link to. It was interesting, and it helped to answer my question. Thanks for posting it.
Thanks!
Great post, thanks! I thought it was really interesting to see the map showing the number of moderate-strong El Nino winters that had below normal snowfall. It gives some nice context for the snowfall departure map. I love the maps, by the way. Nicely done.
Europe weather
Where can I get similar information on European weather this coming winter?
The data used in this post…
The data used in this post is from the European Centre for Medium-Range Weather Forecasts. They have a climate page here that is useful, but I'm not sure if they have snowfall readily available: https://climate.copernicus.eu
Complaints
Whether the weather be good or whether the weather be bad. We'll weather the weather, whatever the weather, whether we like it or not! Listen! I'm tired of you guys just making stuff up. Your control of the weather is poor and your predictions are worse. Please improve your performance!
Control and predictions
1. I don't think they can really control the weather; if they could, I suspect that they would prevent land falling hurricanes, droughts, heat waves, cold waves, human-caused global warming, and billion dollar disasters, among other nasty and unpleasant events. (As well, if they could control it, I would bet that they would ensure crappy weather in Washington, DC, when budget negotiations were going on, so as to ensure that they got more money.)
2. Their forecasting has gotten better since the early 1990s (when I started watching the Weather Channel every day); while their forecasts were generally good for no more than 3 to 4 days back then (the 5th day forecast was fairly correct maybe 50 to 60% of the time), the National Weather Service can now make accurate forecasts for a week in advance--and the forecast for day 7 seems to be fairly correct more often than not. And, my father has told me that, in the 1950s, weather forecasts were only made for the next day or two, and that they really could not make accurate predictions beyond that. So, their forecasts have been getting better over the years, and are continuing to improve.
3. As I have learned, there are a lot of elements that go into predicting what the weather for the next 3 months will be like. El Niño is one factor (and it is an important one), but there are a lot of other ones as well, plus there are some things that cannot be predicted more than a few days or weeks in advance (such as sudden stratospheric warming events during the winter).
On top of that, as I have noticed, they merely talk about probabilities rather than certainties when dealing with forecasts over the next few months. As an example, the forecast for the Southern Plains (where I live) for this winter calls for a greater probability of above normal precipitation and average temperatures, though it says absolutely nothing about the odds of things like cold snaps or warm spells. The weather here this winter may or may not turn out like that; it just means that the odds are that it will be that way. So, I bear it in mind while understanding that it might be at least somewhat wrong, and that we will have both warm and cold days this winter.
I agree that it would be nice if they could make better long-term predictions. However, I am sure that they will improve in the future, as they get more and better instruments for collecting weather data (such as more ocean buoys, weather balloons in more places, more weather stations on land, better satellites, etc.), and as they learn more about different weather phenomena, such as ENSO, sudden stratospheric warming events, the Arctic oscillation, atmospheric gravity waves, and the like. In the meantime, they seem to be doing a pretty good job; more importantly, they seem like they are trying to get even better.
Beautifully put. Thanks!
Beautifully put. Thanks!
Complaints
Loved your comment! LOL!
Hard to read maps
Should post some easier to understand maps that are a little less confusing. Instead of -10 to 10, ranging for different time periods and abating that snow will be less likely there’s no clear direction here. None of these maps indicate any forecast this just proves to be complicated to read and not really showing any real forecast here.
Relative change could be more useful
Rather than absolute inch difference, it could have been more informative to see percentage increase and decrease. In areas that get a lot of snow, you are going to see more variance in the absolute inch change, and the opposite in areas that get less snow. In an area that gets 3 inches of snow average, a difference of +3 inches means double the snow.
I completely agree, but my…
I completely agree, but my significant other (non-scientist) still understands snow in inches more than in percentages. But we'll keep this in mind in the future!
Weather
Weather is controlled by humans. They create hurricane, flooding, earthquakes, droughts, snow storms and anything else to push the climate change agenda. Fires , flooding, hurricane, tornadoes, train derailment, earthquake whatever it takes to take your land home and ownership of anything away. We will be put in smart cities. Have no cars, no privacy and no freedom if the people do not wake up and realize everything is a lie to control the masses! I beg my fellow people around the world to consider everything we are told and shown is all just a big lie.
That tinfoil hat..
...is screwed in a little too tight.
You people are still the…
You people are still the best at what you do. I will keep in touch weekly as you are MOST INTERESTING on the subjects that control or nearly control the weather. SNOW, storms, winter rain events all effect my health as I am approaching EIGHTY, El NINO, the JET STREAM and your moving maps keep me occupied. THANK YOU...Margaret O'Brien HOBOKEN NEW JERSEY USA
El Nino and our WEATHER..SUN SPOTS occurrences.
MINOR HEAT WAVES have an impact also from the BACK OF THE SUN
How does this interfere with EL NINO this year?????
GLOBAL WARMING IS HAPPENING ANYWAY BUT HUMANS ARE ADDING TO IT...KEEP UP THE GOOD WORK ON THE WEATHER.
Snow Lover in New York
I am sad to see this analysis after last year's very disappointing winter which was still a moderate La Niña. Now we are looking at a moderate to strong El Niño and it may be an even less snowy winter (if possible after Central Park recorded their latest measurable snowfall on record). Of course, one big storm can make all the difference (much like one hurricane can make a season a bad one even if the recent of it is quiet) so it remains to see what this year brings. Still, it's rather impressive when 10-13 of 13 El Niños have had less snow from interior New England into the Midwest
Ski-able Snow in NE Ohio
Interesting to contrast this with the Farmers Almanac prediction. I recently moved to NE Ohio from the Pacific NW. Sometimes decisions are made based on the odds, and to me the data further supports my recent transition into ice skating. Time to sell the skis and invest in a better pair of skates.
El Nino and our SUNSPOTS
This is a most informative article. Yet may I invite the nay-sayers to come to Oklahoma. Just wait 15 minutes and the weather will change. The home of Thunder Snow (preceded by lightening of course). We do have some very diverse weather here. Most people are amateur meteorologists by age 15. Understanding the dynamics of weather cycles is quite fascinating.
Wearher
NOAA, you do great work in predicting the weather. You have a lot of variables to consider. Remember the old saying: no such thing as bad weather —-only different kinds of good weather. I don’t like ice on the roads
weather
Even politicians could learn something about double talk from weather forcasters. Most people dont want to know How or Why----we just want to know " Is it going to snow more this winter-period" The answer always to be the same----"Maybe"
Short version for non-meteorologists please
So is it going to snow in the southern United States or what?
Weather/Snow
Seriously? Because of climate change we're gonna have less snowy winters? Guess who's changing the climate? And it isn't man. Good grief.
Snow multi-year re-analysis
Dear Michelle and Rebecca and everyone
Thank you so much for the very informative article . Is there a re-analysis database that allows multi-year re-analysis of snowfall or water equivalence of snowfall that permits multi-year re-analysis simultaneously for the rest of the world other than the USA, Like southern Europe and the Mediterranean region . For example I used your below valuable service at https://psl.noaa.gov/data/atmoswrit/map/ to reconstruct flood risks using the multi-year list which exceeded 30 analogous months and it worked well but snow water equivalence of snow is not active for re-analysis under any of ( ERA5, ERA5-interim, JRA5, MERRA..) .
I am simply looking for any database that permits snowfall re-analysis if you kindly have an advice .
To explain my methods employed : The list of analogous approximate years/months ( n=35) were suggested by an ANN and cluster analysis as possible analogs for 2023-2024 autumn-winter that I have conducted personally , this list was yielded using multivariable analogous years analyses utilizing Long time-series metric values of ( MEI and ON1 ENSO, QBO, MJO, PDO, AMO, AO, NAO, EA-WR , MOi and WeMOi oscillation, LOD, IOD, SST nino regions, and some other relevant physical phenomena forcing factors) . The list of years was very efficient at predicting severe weather and flood risks for the last three seasons me trying to assess the skill of the method .
Do you kindly have any suggested service/advice allowing multiyear analysis for snowfall or water equivalence of snow ? I am lost with databases that did not work to be honest .
NB: I am approaching these data statistically and my work is a statistical programmer .Also Any theoretical /climatic relevance or suggestions on my approach is highly appreciated.
Thank you so much by all results and outcomes
Mohammad Alkhateeb
The Hashemite Kingdom of Jordan
"Reanalysis" is a type of…
"Reanalysis" is a type of dataset, rather than a service like the PSL site. I think you'd need to obtain the dataset and then subset it yourself. You might also check out the IRI's Climate Predictability Tool, here: https://iri.columbia.edu/our-expertise/climate/tools/cpt/ .
Global warming
mankind is not in control of the weather in any shape or form. Global warming has been going on for a very long time..much longer than man has been around, at least this time. No one was around when the ice age was in full effect
Real help to understand maps.
Not kidding here or trying to sound sarcastic. If you’re having any difficulty in understanding these truly excellent maps (Top Notch work by the way), ask a kid for help. Kids today are just as smart as they have always been. So just ask a kid. Hand them the information and let them show you. You’ll be surprised.
Clarification of units
Are the results in inches of snow or inches of SWE?
I also have questions about the detrending but the question may be difficult for me to describe. But here is a try.
Usually when comparing things you try to move them to the same year often the present time or the past time but it does not matter as long as it is the same year. But doing that for this analysis (using climate models) would defeat the purpose of the analysis except that for some purposes you are working with the average of all years and for other purposes just El Nino years and also a subset of El Nino Years to Moderate to Strong El Nino years.
So can you clarify what you mean by detrending and how you did it?
By the way I just published an article on your post at https://econcurrents.com/2023/11/23/el-nino-and-snowfall-november-24-20…; All corrections to what I said would be appreciated and probably should be posted as comments to my article but could be published here.
I thought you wrote a great post. So thank you.
❄️🌧️🌞
Whether it's sunny or whether it's hot, there's gonna be weather, whether or not! 😁
Comments have been disabled on this article