Blogs
This is a guest post by Dr. Amy Butler (@DrAHButler) who is a research scientist at the University of Colorado Cooperative Institute for Research in Environmental Sciences (CIRES) and sits within the NOAA Chemical Sciences Division (CSD). Her research focuses on large-scale climate patterns and phenomenon, such as the Arctic and Antarctic Oscillations and sudden stratospheric warmings.
“’Polar vortex’ set to strike the U.S. as snowstorm death toll rises” (Slate). “Polar vortex transforms Mid-Atlantic to Mid-Antarctic” (Washington Post). “Economic impact of ‘polar vortex’ could reach $5B” (CBS News). These are all real headlines from 2014 and 2015, when the phrase “polar vortex…
Read article
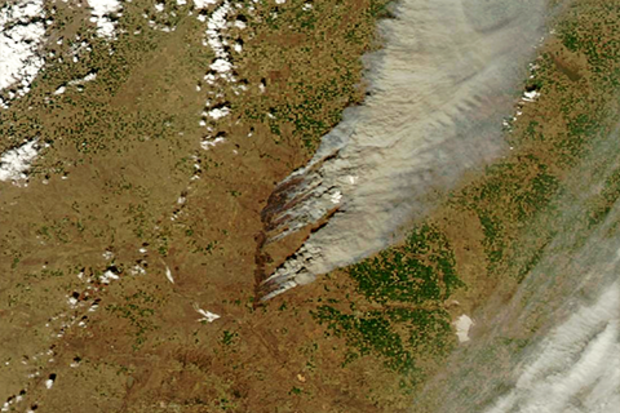
Welcome to Beyond the Data. This week, we’ll talk a little bit about wildfire. Specifically, prairie fire.
Before we do that, I hope you don’t mind if I take a second to process a couple of facts about March 2016. First, that the world’s land areas averaged 4.2°F warmer than the month’s 20th century average. Second, compared to March’s 1981-2010 “normal,” the Northern Hemisphere’s combined area of “missing” sea ice and snow cover would cover more than a tenth of the moon.
(stunned silence) Whoa.
Now let’s talk about the prairie
In our previous entry, we visited a little bit about 2016’s very warm start across the United States, and the regional pockets of very dry conditions amon…
Read article
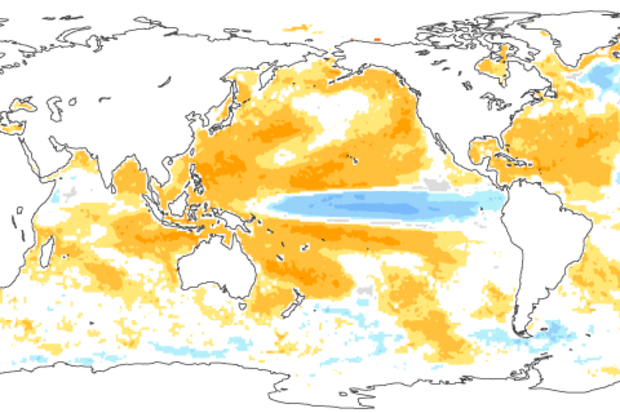
It will soon be time to bid good-bye to the strong El Niño of 2015-2016. Forecasters anticipate that sea surface temperatures in the Niño3.4 region will drop below the El Niño threshold (0.5°C above the long-term average) in the late spring or early summer. After more than a year of El Niño conditions, what’s next?
First, though—what’s now?
The average anomaly (departure from average) in the Niño3.4 region during March still reflected a strong El Niño, at 1.6°C in the ERSSTv4 dataset. However, this was a substantial drop from February’s 2.0°C, which is what we’d expect during the demise of an El Niño.
The atmosphere was still responding to those warmer-than-average El Niño surfa…
Read article
The data are in, and it’s official: March was warm. And parts of the country were dry. And parts were really wet. And you can read all about it in the monthly State of the Climate report.
Let’s go Beyond the Data for March, and hit on a few more complex items embedded within the basic statistics.
Unprecedented widespread warmth
If you were alive during March 2016, and I’m betting you were, you witnessed U.S. history.
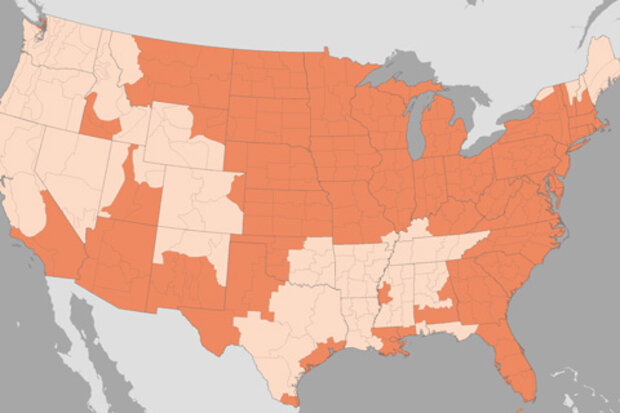
One stunning feature from the March 2016 temperature map was just how universally warm the month was. Every one of the 357 climate divisions across the contiguous United States and Alaska ended up - at least - in the “warmer than normal” category. That’s harder than …
Read article
This is a guest post by Dr. Amy Solomon and Dr. Gil Compo of the NOAA Earth System Research Laboratory and the Cooperative Institute for Research in Environmental Sciences of the University of Colorado-Boulder. Both scientists sit within the Physical Sciences Division, which took on a leading role in the El Niño Rapid Response Campaign. They excel at improving our process-based understanding of the models and developing reanalysis datasets, which are critical to understanding and predicting weather and climate.
The ongoing El Niño of 2015-2016 is a historically strong event, the likes of which is only seen once or twice during a scientific career. Not wanting to let this opportunity pass…
Read article


