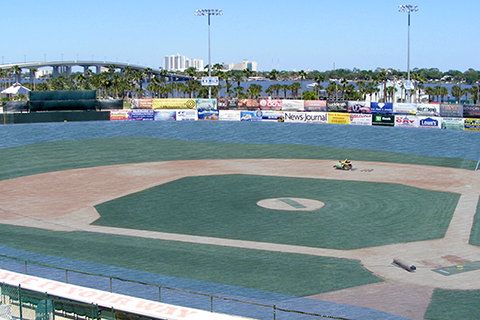
The CanVis tool from NOAA’s Coastal Services Center creates images of potential coastal changes, letting planners and citizens put changes in perspective before they happen.
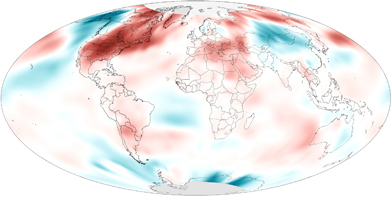
How do we know we can trust the historical surface temperature record? How do we know the rise in carbon dioxide in the atmosphere comes from fossil fuels? Did global warming stop in 1998? Get answers to these and other frequently asked questions.
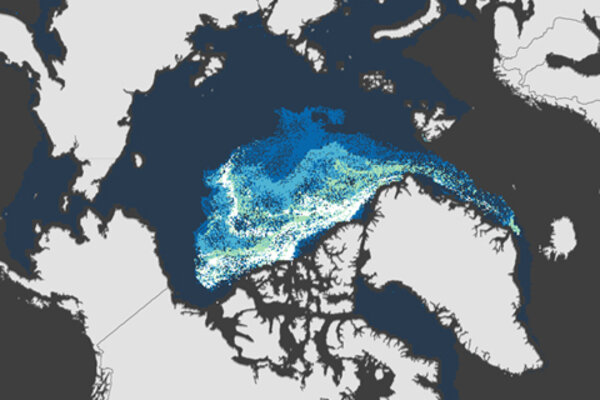
Very little old sea ice remains in the Arctic
December 13, 2013
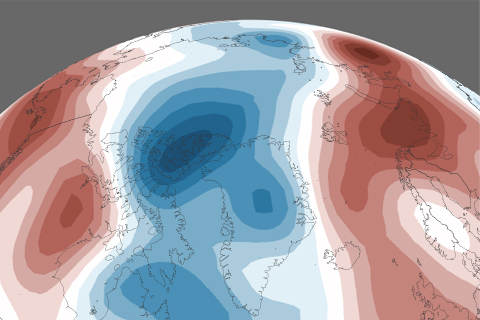
From reindeer to regional temperature patterns, from sea ice age to Greenland surface melt, the Arctic Report Card is a yearly assessment of the Arctic's physical and biological systems and how they are changing. This collection of visual highlights from the 2013 report is a story of the Arctic in pictures.
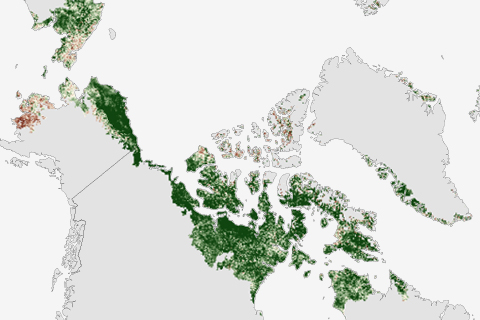
Since observations began in 1982, Arctic-wide tundra vegetation productivity has increased. In North America, the rate of greening has accelerated since 2005.
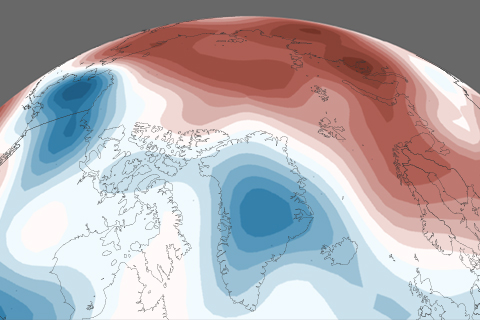
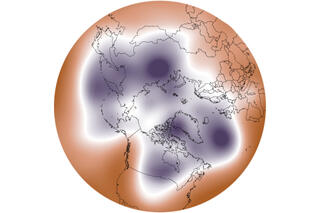
Since the mid-1960s, the Arctic has warmed about 3.6°F (2.0°C)—more than double the amount of warming in lower latitudes. In 2012 (the last complete calendar year available at the time scientists began working on the 2013 Arctic Report Card), the annual average temperature was the sixth warmest on record.
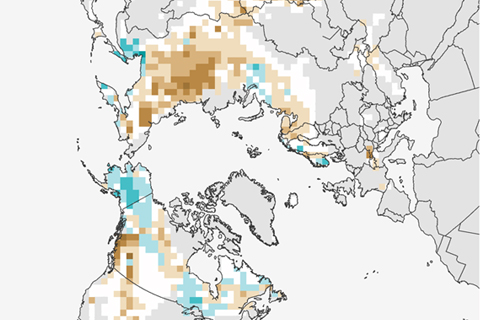
In May 2013, there was record-setting loss of Eurasian spring snow cover, and spring snow cover was below normal again in June—the fourth lowest on record. This is the sixth year in a row that Eurasia has set a new record low in either May or June snow extent.
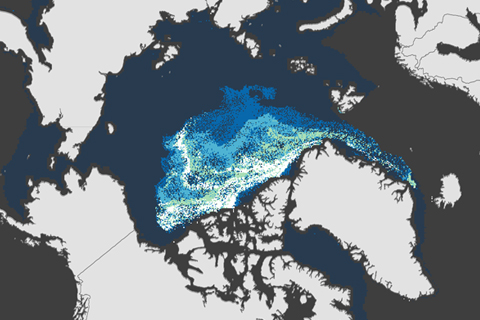
In March 1988, thick, multi-year ice comprised 26 percent of the Arctic's ice pack. In 2005, that number dropped to 19 percent. In 2013, it dropped to 7 percent.
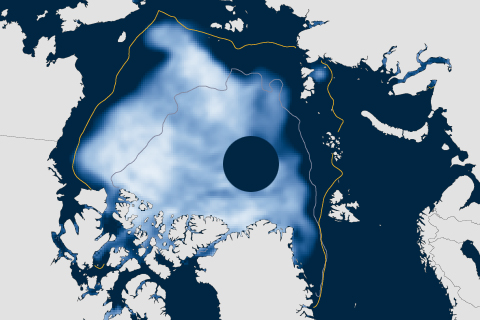
Averaged over September 2013, sea ice extent was 2.07 million square miles—larger than last year's record low, but still more than 17 percent below average and the sixth smallest September extent on record.
