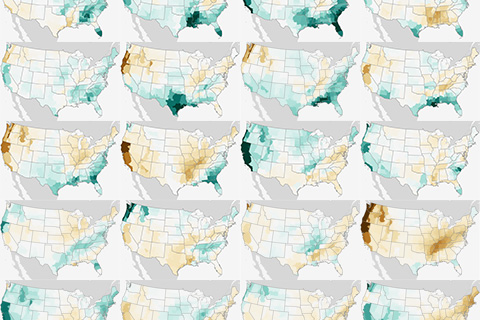
(UPDATED) Winter precipitation across the contiguous United States during every El Niño since 1950.
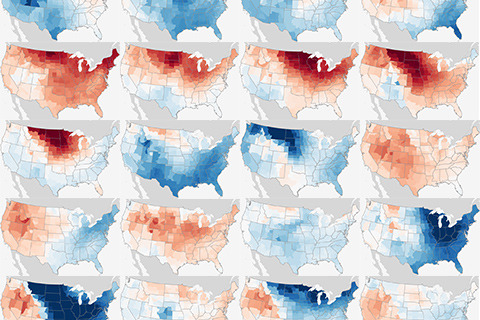
(Updated). Maps showing winter temperatures across the contiguous United States during every El Niño since 1950.
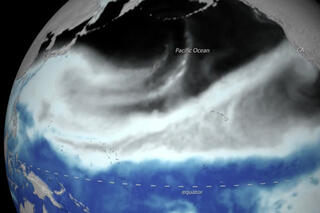
Rains return to California to start 2016
February 3, 2016
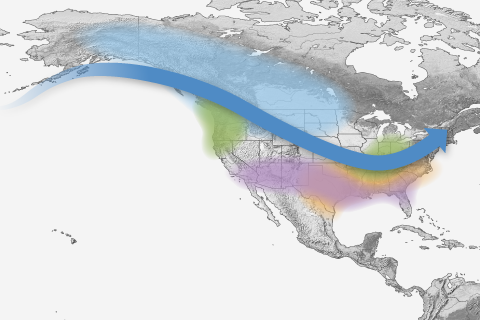
Free to good home! NOAA Climate.gov provides hundreds of images and maps that are free for re-use. This page gathers up links to our most popular El Niño and La Niña images.
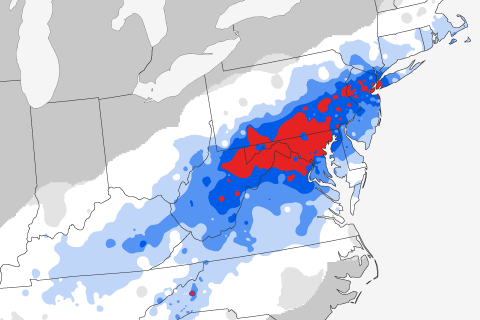
According to NOAA’s Regional Snowfall Index, the January 22–24, 2016, snowstorm ranked as a Category 5 —“crippling”—event for both the Northeast and Southeast.
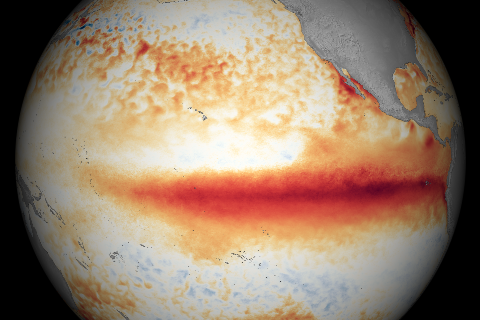
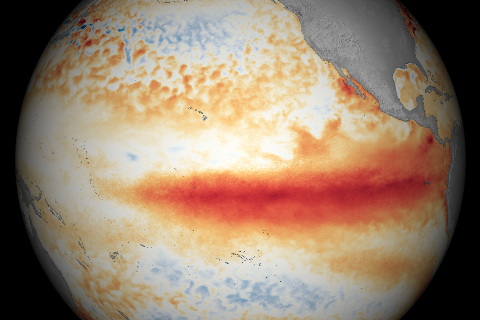
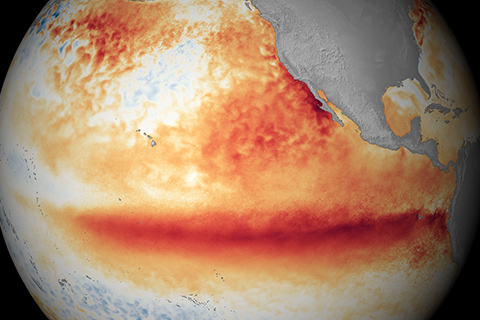
A strong El Niño continued during December 2015 with well above average sea surface temperatures across the central and eastern equatorial Pacific Ocean, according to NOAA Climate Prediction Center’s monthly El Niño advisory update.
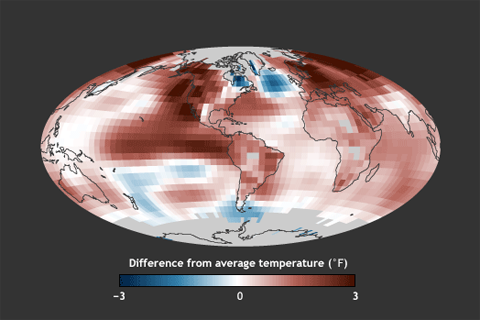
Global surface temperature was record warm in 2015, moving ahead of the record set just last year by 0.29°F—the largest margin by which one year has ever beaten another since official records began in 1880.
Answers to some of the questions that readers frequently ask NOAA experts about El Niño and La Niña.
