
How can climate extremes affect our nation’s most popular alcoholic beverage?
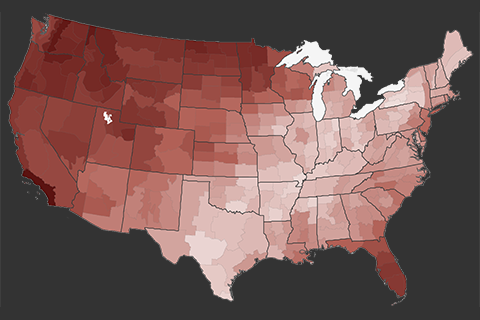
The 2015 annual average U.S. temperature was 54.4°F, 2.4°F above the 20th century average, the second warmest year on record.
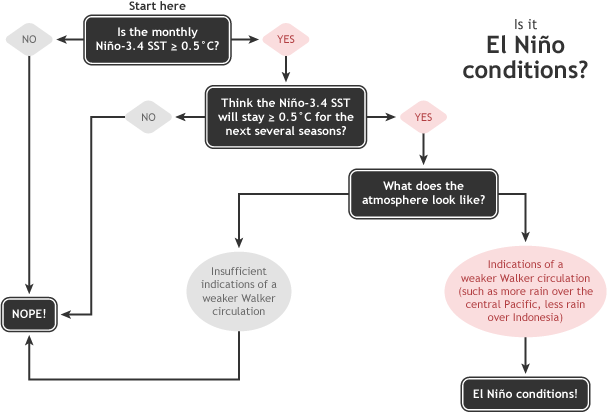
NOAA's Climate Prediction Center monitors and issues outlooks for El Niño and La Niña using a 2-category (watch/advisory) alert system.
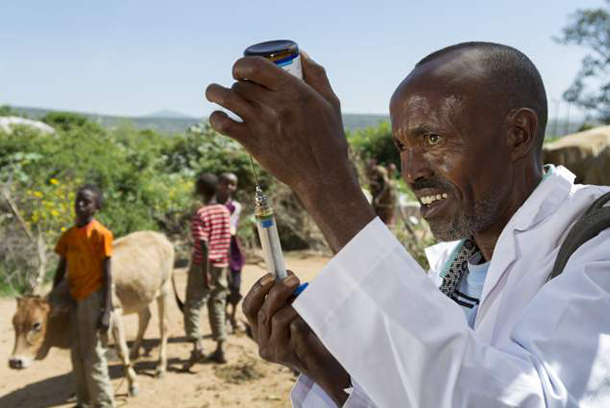
With this year's ongoing El Niño event, parts of East Africa may be ripe for a potential outbreak of Rift Valley Fever. See how government agencies are using climate data to help predict, and hopefully prevent, an outbreak of this deadly mosquito-borne virus that affects both people and valuable livestock.

Walruses use sea ice for mating, giving birth, and resting, which means they face an increasing threat from global warming.
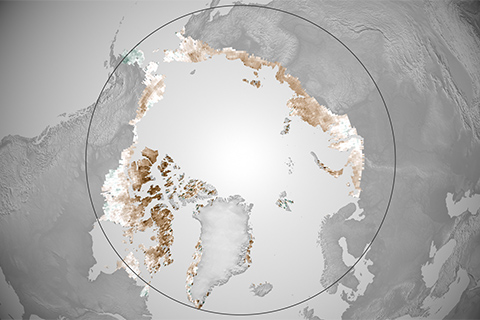
As the Arctic has warmed over the past three decades, satellites reveal it has also grown greener overall. But in recent years, the tundra appears to be “browning down.”
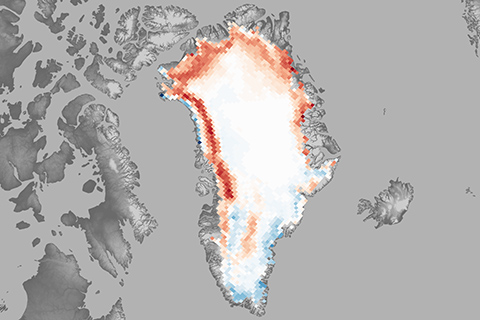
The melt season was up to 30 to 40 days longer than average in western, northwestern, and northeastern Greenland, but was close to or below average elsewhere on the ice sheet. Melt area was above average on 52 of the 90 days of the melt season.
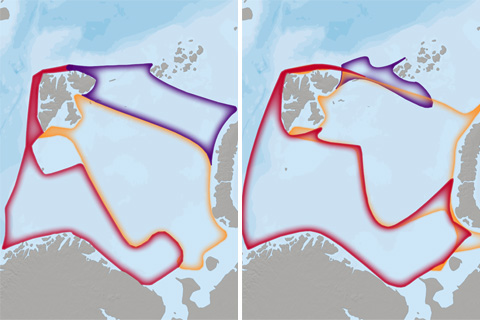
Not only are there now bigger fish to fry in the Arctic's Barents Sea, but scientists predict the natural marine ecosystem will undergo a transformation.
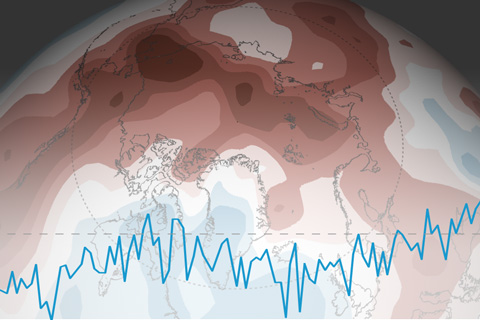
“Arctic amplification” of climate change remained in full swing in 2015, according to the 2015 Arctic Report Card. Broad areas of the Arctic were more than 5°F (3°C) warmer than average during the report card’s monitoring year (October 2014-September 2015).
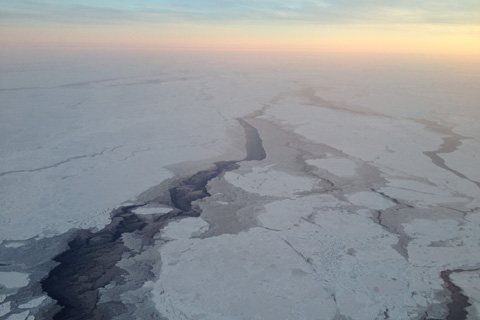
Increasing air and sea surface temperatures, decreasing sea ice extent and Greenland ice sheet mass, and changing behavior of fish and walrus are among key observations released today in the Arctic Report Card 2015.