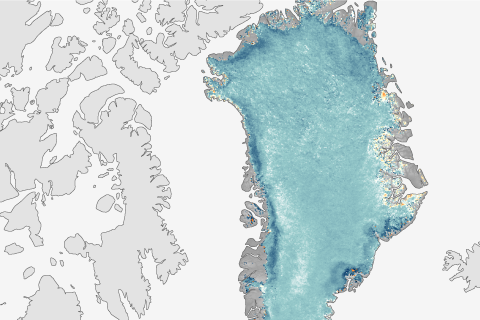
Punctuating a trend of declining reflectivity, the Greenland Ice Sheet reflected less sunlight in August 2014 than it did in any previous summer on record.
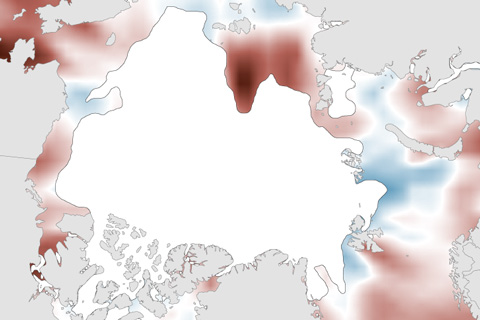
Compared to 2012’s extreme warmth, surface water temperatures were more moderate in summer 2014. Nevertheless, pockets of very warm temperatures existed.
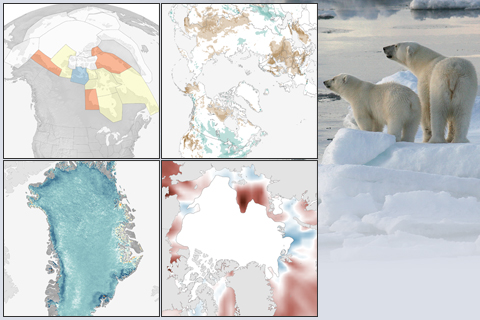
The latest installment of NOAA's Arctic Report Card confirms that Arctic air temperatures are rising at more than twice the rate of the planet as a whole. This collection of images highlights some of the key changes in physical and biological conditions in the Far North.
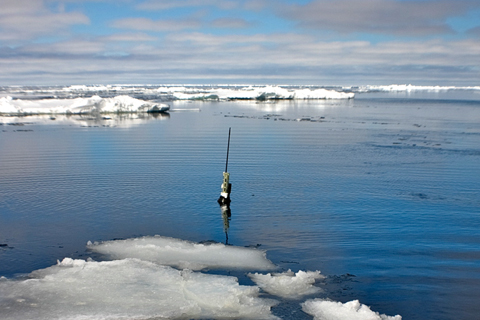
A worldwide network of Argo floats gives scientists an unprecedented understanding of the ocean depths. Argo floats descend and ascend through the top 2,000 meters of the ocean, collecting observations as they move.
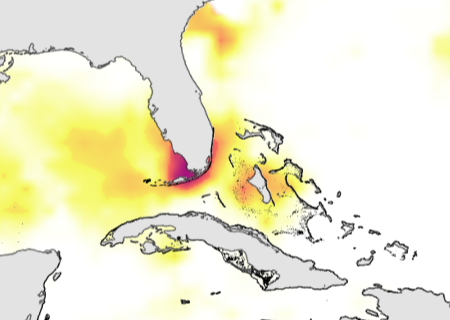
From Hawaii to the Florida Keys, the surprising intensity of coral heat stress in 2014 has scientists wondering what to expect in 2015, when El Niño is forecasted to finally develop.

Using Climate Outlooks on the Farm
December 3, 2014
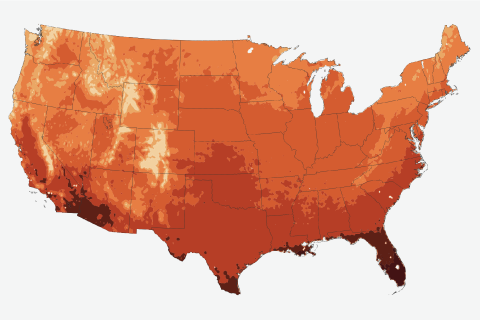
Warmer winters or hotter summers: which will have greater influence on U.S. energy demands this century?
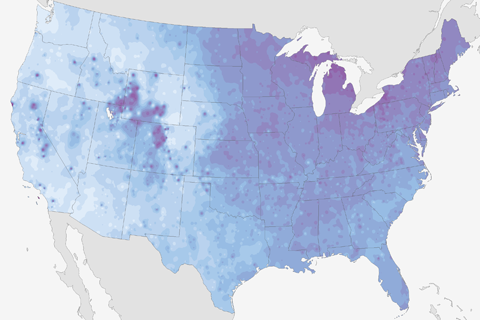
For some states, the coldest day of the year usually occurs near the start of winter, while for others it comes near the end. This map reveals when history says your state will have its coldest day of the year.
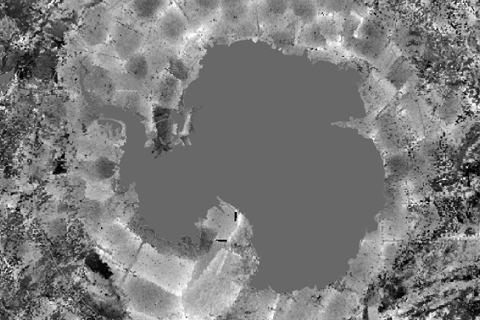
Recovered satellite images of Antarctica showed a larger sea ice extent than ever measured before—but the record was short lived. The record was broken in September 2014, only weeks after the discovery.
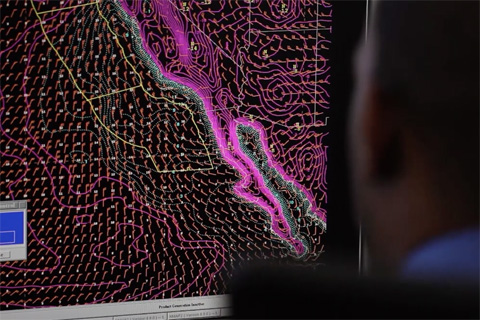
From changes in cooling degree days to the local effects of El Niño, the Local Climate Analysis Tool helps meteorologists and others understand the connection between global climate and local impacts.