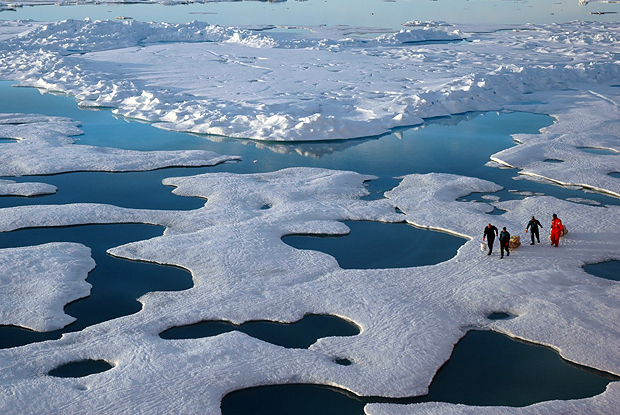
Each summer, the seasonal unraveling of the Arctic’s blanket of ice exposes large areas of the ocean to solar heating. The smaller the ice extent, the larger the potential warming influence. Arctic sea ice extent in July 2011 was the lowest for that month in the satellite record.
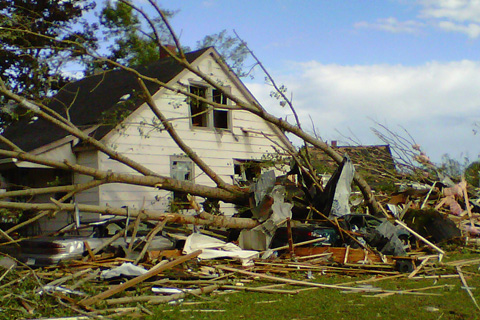
What began as an ordinary Sunday on August 21, 2011, became anything but ordinary for residents of Goderich, Ontario, as an EF-3 tornado (winds between 136-165 mph) ripped through their historic town.
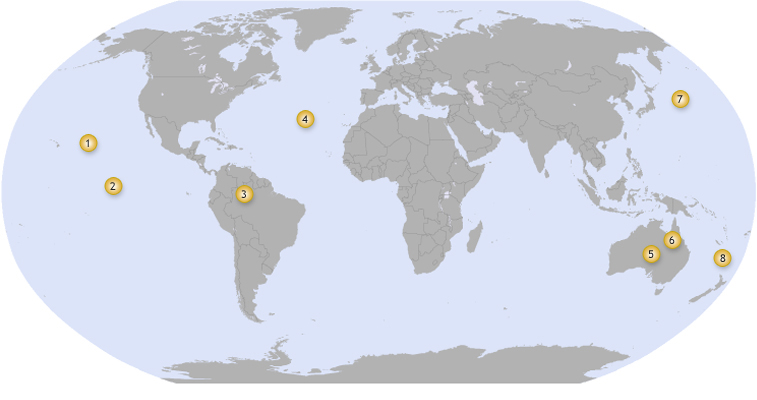
From drought in the Amazon to Australia's record spring rains, this interactive map highlights significant regional climate events in 2010 that were influenced by El Niño and La Niña.

A map of each location where a daily heat record was broken in July 2010 creates a nearly complete image of the contiguous United States.
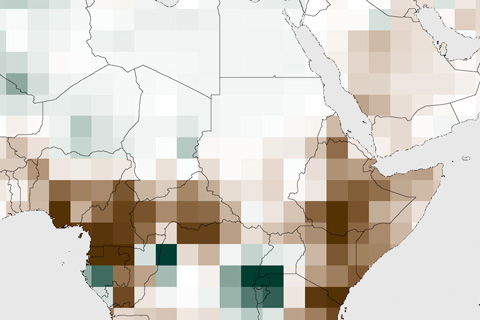
In the semi-arid Horn of Africa, rain comes in two seasons: the “short rains” of October-December and the “long rains” of March-June. In late 2010 and early 2011, both rainy seasons brought scant rain to the region, which led devastating drought across several countries in 2011. In Somalia, the drought escalated to famine.
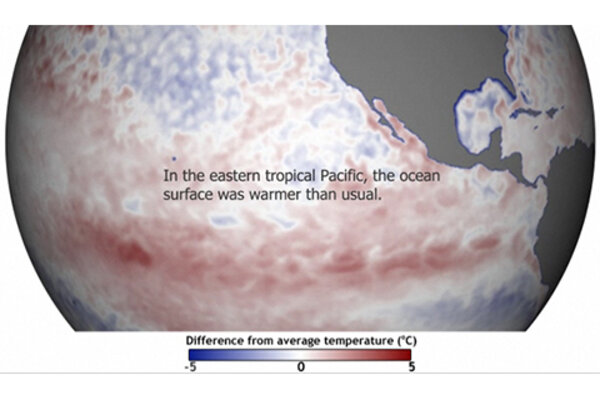
2010 Began with El Niño, Ended with La Niña
August 9, 2011
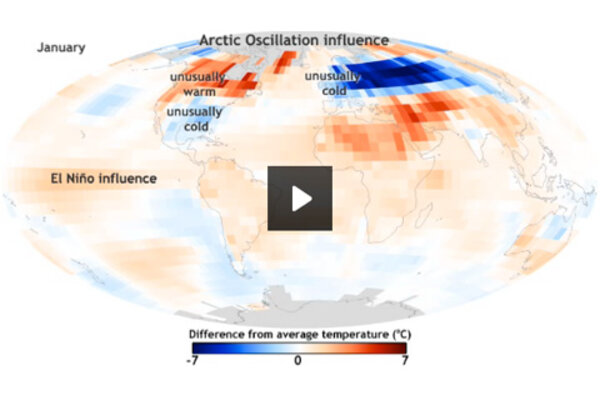
Hot & Cold: Monthly Temperature Anomalies in 2010
August 9, 2011
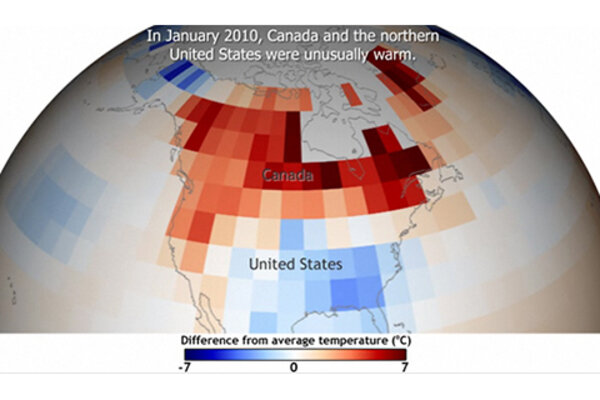
Arctic Oscillation Left Its Mark on N. Hemisphere 2010 Temps
August 9, 2011
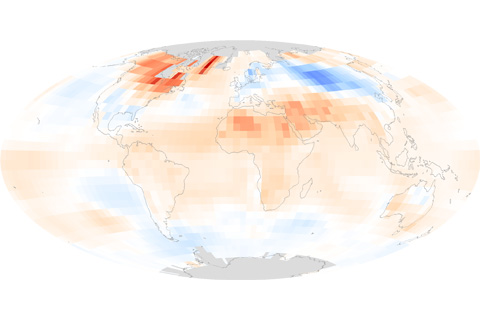
Two natural climate patterns, the Arctic Oscillation and the El Niño-Southern Oscillation, had strong influences on the patterns of unusually warm and unusually cool spots worldwide in early and late 2010.
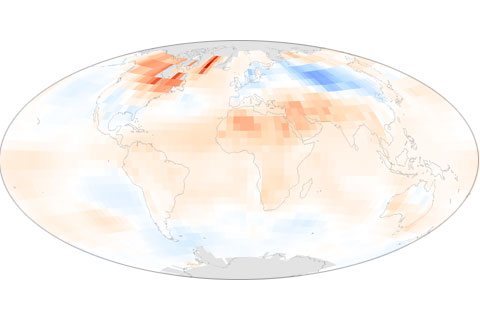
In 2010, global temperatures were marked by near-record warmth and strong natural variability. This is the first in a series of posts highlighting findings from the "State of the Climate in 2010" report.