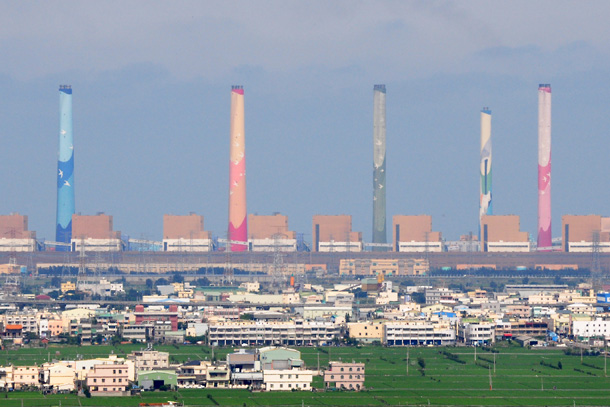
Concentration of carbon dioxide is about 1.4 times what it was before the Industrial Revolution. How much and how fast will Earth warm if carbon dioxide concentrations double the pre-industrial?
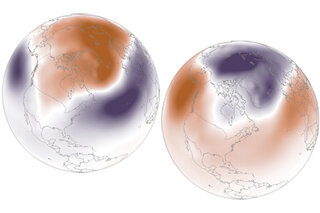
How is the polar vortex related to the Arctic Oscillation?
January 20, 2014
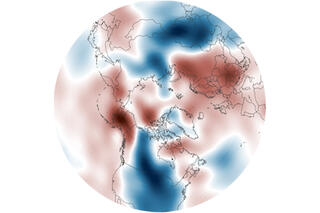
Polar vortex brings cold here and there, but not everywhere
January 10, 2014
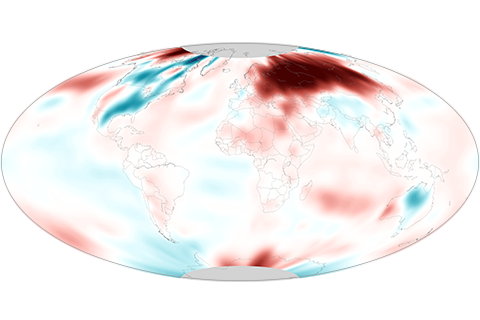
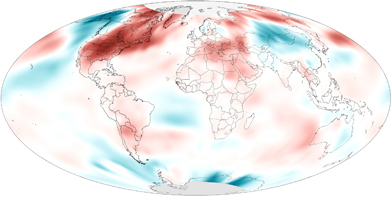
While much of the United States was cooler than average in November, the globe as a whole set a new record for warmth.
How do we know we can trust the historical surface temperature record? How do we know the rise in carbon dioxide in the atmosphere comes from fossil fuels? Did global warming stop in 1998? Get answers to these and other frequently asked questions.

For those of you dreaming of a white Christmas, NOAA has a map showing the historic probability of your dream coming true.
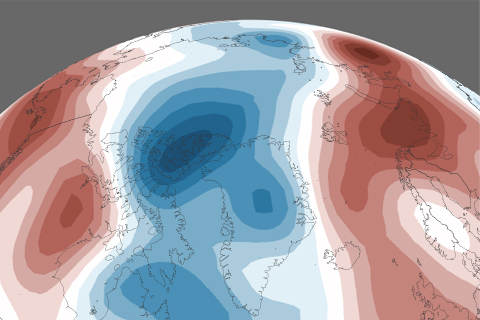
From reindeer to regional temperature patterns, from sea ice age to Greenland surface melt, the Arctic Report Card is a yearly assessment of the Arctic's physical and biological systems and how they are changing. This collection of visual highlights from the 2013 report is a story of the Arctic in pictures.
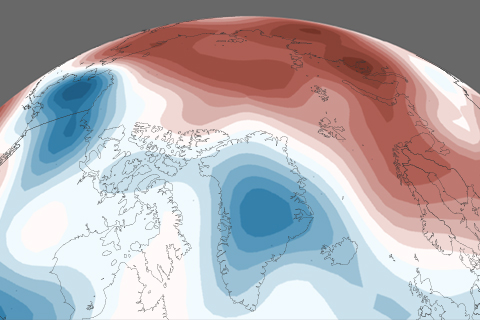
Since the mid-1960s, the Arctic has warmed about 3.6°F (2.0°C)—more than double the amount of warming in lower latitudes. In 2012 (the last complete calendar year available at the time scientists began working on the 2013 Arctic Report Card), the annual average temperature was the sixth warmest on record.
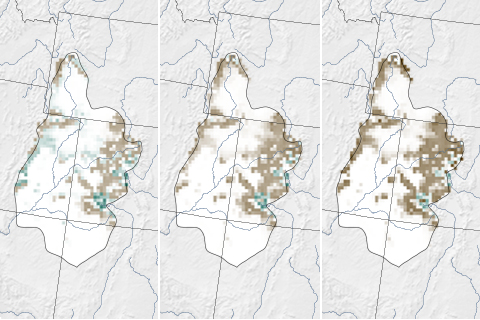
Models project that extreme dust events combined with global warming could advance the spring thaw in the mountains of the Upper Colorado River Basin by as many as 6 weeks by 2050. The earlier disappearance of snow could amplify water disputes, extend the fire season, and stress aquatic ecosystems.
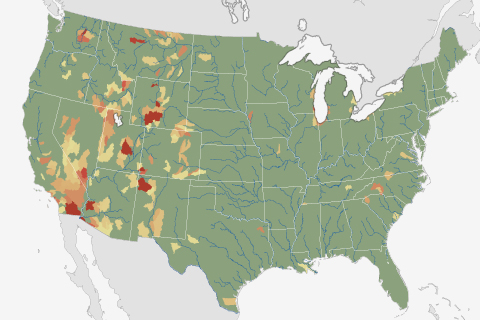
Nearly ten percent of U.S. watersheds are living beyond their means when it comes to their water supply. For nearly half the country, water stress is projected to worsen by mid-century because of climate change, according to a recent NOAA-funded analysis.