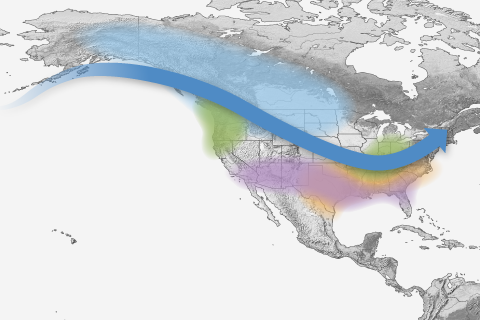
Free to good home! NOAA Climate.gov provides hundreds of images and maps that are free for re-use. This page gathers up links to our most popular El Niño and La Niña images.

Free to good home! NOAA Climate.gov provides hundreds of images and maps that are free for re-use. This page gathers up links to our most popular El Niño and La Niña images.
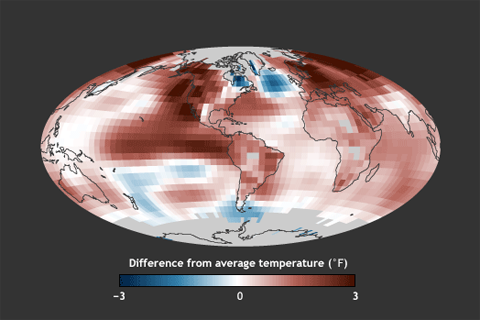
Global surface temperature was record warm in 2015, moving ahead of the record set just last year by 0.29°F—the largest margin by which one year has ever beaten another since official records began in 1880.
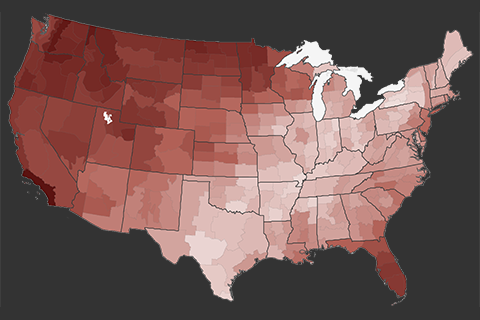
The 2015 annual average U.S. temperature was 54.4°F, 2.4°F above the 20th century average, the second warmest year on record.
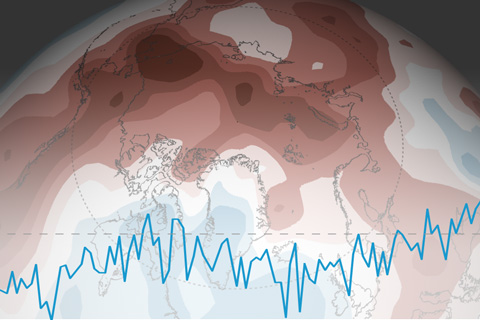
“Arctic amplification” of climate change remained in full swing in 2015, according to the 2015 Arctic Report Card. Broad areas of the Arctic were more than 5°F (3°C) warmer than average during the report card’s monitoring year (October 2014-September 2015).
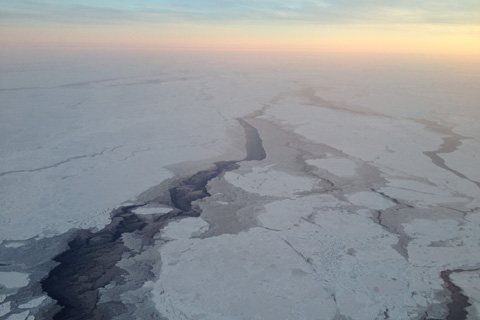
Increasing air and sea surface temperatures, decreasing sea ice extent and Greenland ice sheet mass, and changing behavior of fish and walrus are among key observations released today in the Arctic Report Card 2015.
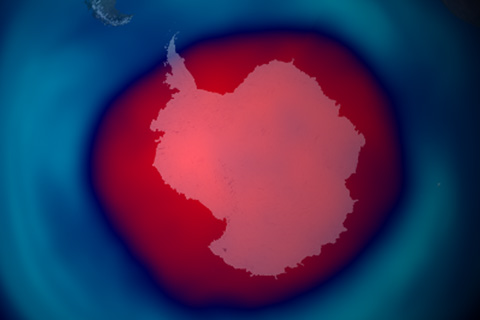
Thanks to an unusually cold winter in the Antarctic stratosphere, the 2015 ozone hole was larger than it has been in recent years.
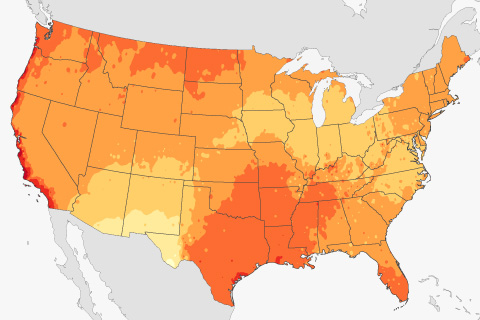
Based on observations from 1991-2020, much of the United States has its hottest day of the year by the end of July. Historically speaking, where is the warmest day likely still to come?

Plants on land have helped slow global warming by capturing nearly a quarter of the carbon dioxide that human activities release in an average year. But where is it all going?
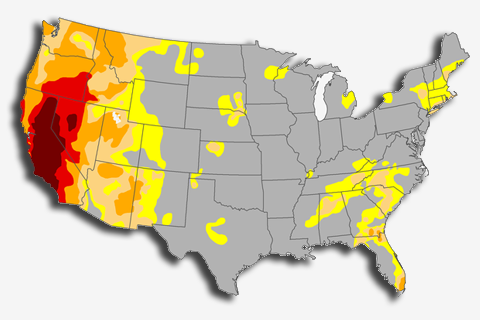
The June round of our “Climate Challenge” social media game pitted experts against players to answer the following question: What percent area of the United States will be in severe drought or worse in June 2015?