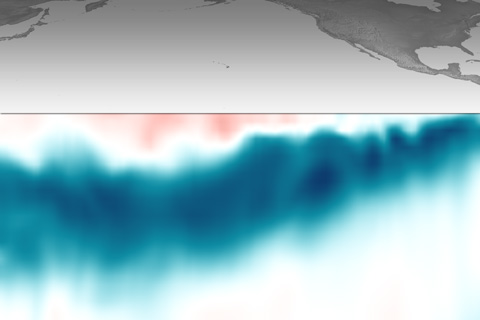
Beneath the surface of the tropical Pacific, a deep pool of cool water has been sliding slowly eastward. This massive, slow-motion wave is a favorable sign that La Niña might develop.

Beneath the surface of the tropical Pacific, a deep pool of cool water has been sliding slowly eastward. This massive, slow-motion wave is a favorable sign that La Niña might develop.
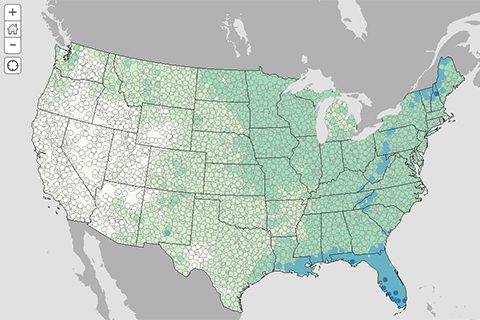
If you had to pick your Fourth of July picnic location based solely on past weather, where does the climate record say you'll have the least chance of rain? Our interactive map shows historic odds of rain on your parade.
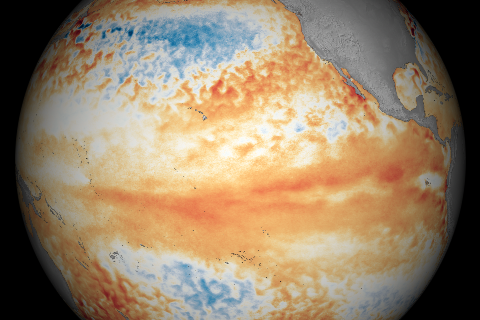
Compared to March, parts of the tropical Pacific showed signs of cooling off in April 2016.
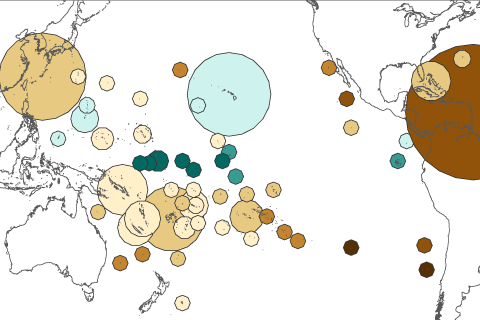
Based on rainfall changes alone, half of the island groups in a recent study were projected to get drier by the end of the century. When scientists also accounted for more evaporation due to rising temperatures, nearly three-quarters of the islands studied were projected to face freshwater stress.
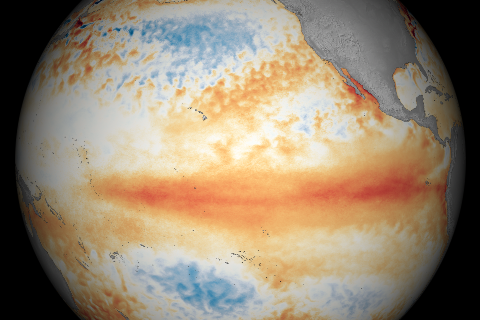
Temperatures across the tropical Pacific Ocean were warmer than average in March 2016.
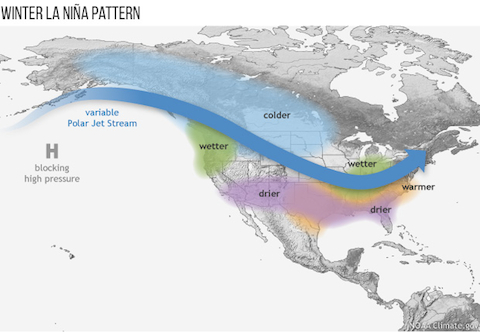
Last week, NOAA issued a La Niña watch, indicating conditions are favorable for the development of La Niña this winter. What does a La Niña winter typically mean for the U.S.?
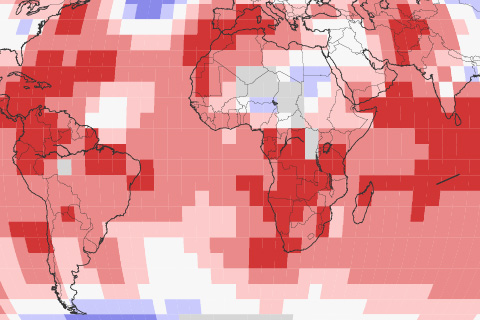
January 2016 became the ninth month in a row to set a new record-warmest monthly temperature.
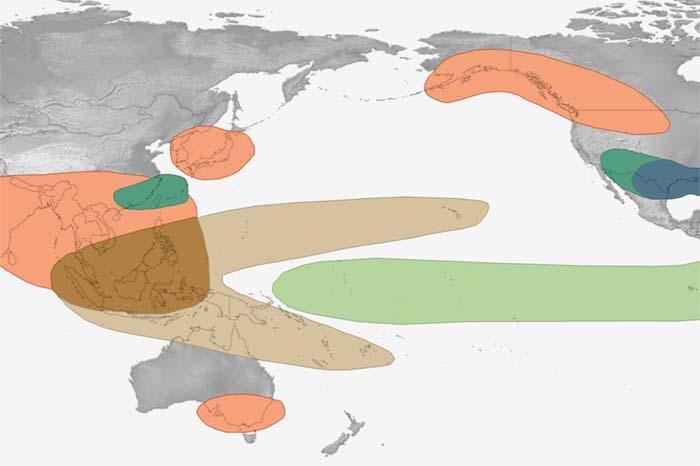
The disruptions of tropical Pacific sea surface temperature and rainfall that occur during the climate pattern called "ENSO" trigger a cascade of global side effects. These maps show how El Niño and La Niña affect seasonal climate around the world.
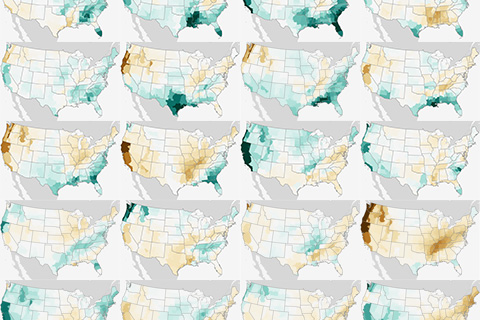
(UPDATED) Winter precipitation across the contiguous United States during every El Niño since 1950.
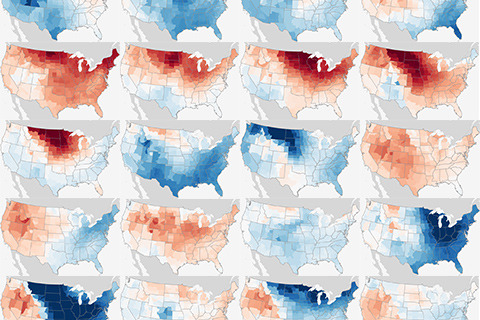
(Updated). Maps showing winter temperatures across the contiguous United States during every El Niño since 1950.