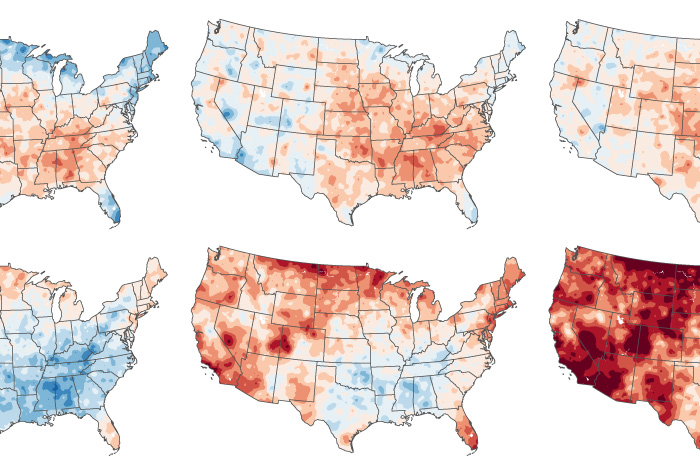
Every ten years, NOAA releases an analysis of U.S. weather of the past three decades, calculating average values for temperature, rainfall, and other climate conditions that have come to represent the new “normals” of our changing climate.
Every ten years, NOAA releases an analysis of U.S. weather of the past three decades, calculating average values for temperature, rainfall, and other climate conditions that have come to represent the new “normals” of our changing climate.
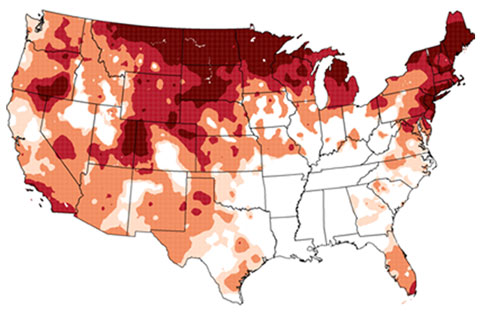
If the recent weather whiplash has left you wondering how U.S. winters are changing over time, NOAA climate maps tell the story.
Find your favorites: an index page of links to ENSO blog posts.
In this Beyond the Data blog, Deke Arndt talks about using the climate record to predict the odds of rain on the Fourth of July.