May 2018 ENSO update: Thar she goes
First off, happy blogiversary to our readers and the ENSO blog team! Hard to believe my first post was four years ago this month. Who would have thought we would still have so much to say about ENSO and the world of climate forecasting? If you’re new to us, or want to revisit old favorites, be sure to check out the index page our amazing editor put together.
Sayonara, sweetheart
Onward! Our next order of business is to bid adieu to La Niña, as the sea surface temperature in the tropical Pacific returned to neutral conditions in April—that is, within 0.5°C of the long-term average.
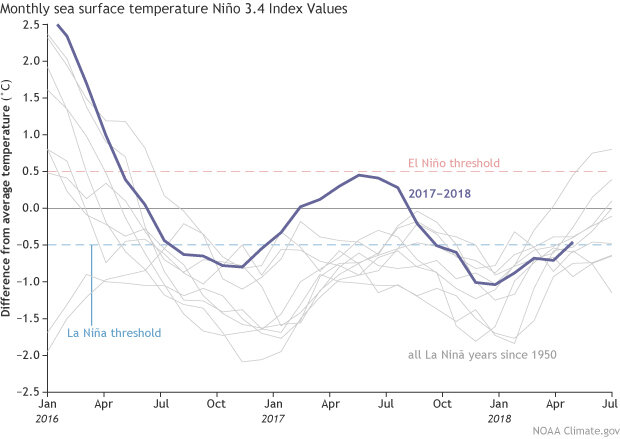
Monthly sea surface temperature in the Niño 3.4 region of the tropical Pacific compared to the long-term average for all multi-year La Niñas since 1950, showing how 2016–18 (blue line) compares to other events. Multi-year La Niña events are defined as at least 2 years in a row where the La Niña criteria are met. Both continuous events, when the Oceanic Niño Index (ONI) remained below -0.5°C, and years when the ONI warmed mid-year before again cooling, are included here. For three-year events, both years 1-2 and 2-3 are shown. Climate.gov graph based on ERSSTv5 temperature data.
The temperature of the water below the surface remained above-average, as the large area of warmer-than-average subsurface waters continued to move slowly to the east (a downwelling Kelvin wave). This warm area will continue to erode the remaining cooler surface waters over the next few months.
The tropical atmosphere is also looking mostly neutral. Rainfall over Indonesia was below average, and the near-surface winds were close to average, as La Niña’s strengthened Walker circulation faded.
Memories
Let’s look back on the past few months, to see how much February–April global temperature and rain patterns reflected those expected (temperature, rain) during La Niña! The maps linked here show both the changes expected during ENSO and the observed temperature trends, and the combination of the two.
It’s important to remember that La Niña wasn’t the only game in town this year. Some of the other weather and climate patterns at play over the past few months included the Madden-Julian Oscillation, a sudden stratospheric warming, and, of course, global warming. As we’ve documented here at the ENSO Blog, these patterns have their own distinct effects on temperature and precipitation patterns, and attributing weather events to climate patterns is a complicated science.
That said, the 2018 late winter/early spring period over North America showed many similarities to what we’d expect during La Niña. In North America, February–April during La Niña tends to be cooler than average in the northern half of the US and through Canada, and warmer than average through Texas and the South and into Mexico. When you add in the temperature trend during this time of year (slight cooling though the northern Midwest, warming across the Southwest), you get a pattern much like that observed during 2018.
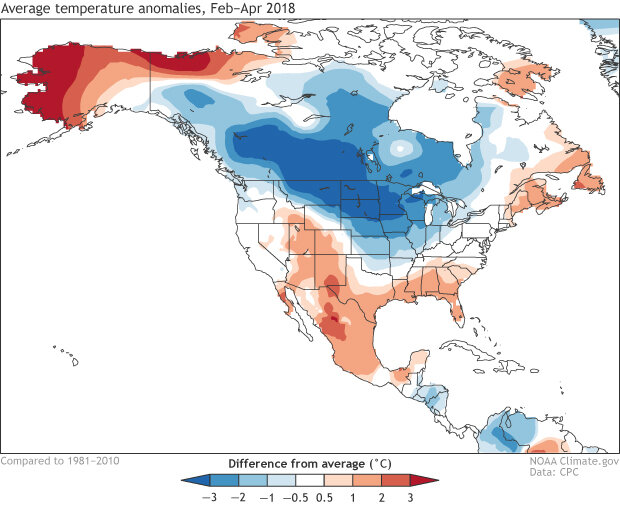
February–April 2018 surface temperature patterns, shown as the difference from the long-term mean. Climate.gov figure from CPC data.
Also typical in February–April during La Niña conditions is more rain than average through the Ohio valley, and drier weather in Florida and through the U.S. Southwest, generally similar to what was observed this year. The lack of rain in the Southwest has contributed to the extreme drought and wildfire conditions this year.
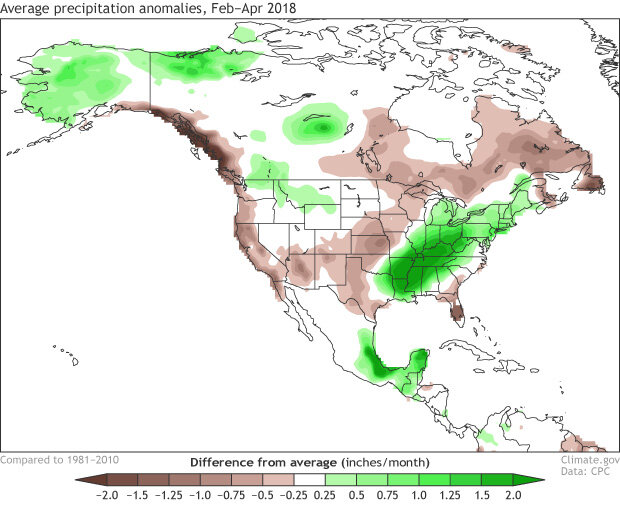
February–March 2018 rain and snow patterns, shown as the difference from the long-term mean. Climate.gov figure from CPC data.
What the future holds
Enough looking back! Let’s look forward! As we’ve discussed before, making ENSO forecasts in spring is especially complicated. It’s a time of transition, and small changes in conditions can have large effects down the road. This month’s ENSO forecast finds it most likely that neutral conditions will last through the summer and into early fall. Most of the climate models support this.
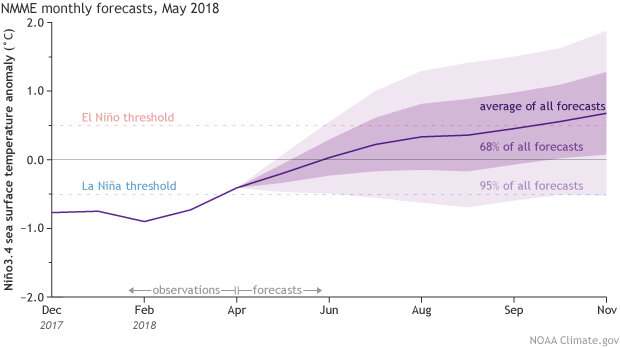
Climate model forecasts for the Niño3.4 Index, from the North American Multi-Model Ensemble (NMME). Darker purple envelope shows the range of 68% of all model forecasts; lighter purple shows the range of 95% of all model forecasts. NOAA Climate.gov image from CPC data.
What about next winter?? The forecast possibility of El Niño nears 50% by the winter, as many of the computer models are trending to warmer tropical sea surface conditions in the later months of 2018. In the historical record (dating back to 1950) we’ve had 7 two-year La Niña events. These events have been followed by El Niño twice: 1972 and 2009. The probability of remaining in neutral conditions is about 40%, something that has happened three times in the record: 1956, 1985, and 2012. Less likely is a return to La Niña conditions—that scenario is given about a 10% chance. A three-peat La Niña isn’t impossible, at all, and has occurred twice in the historical record: 1973–76, and 1998–2001.
One thing we can be certain of is that forecasters are looking forward to next month, when the models are increasingly getting past the spring predictability barrier and are more reliable. See you then!
Comments
only 4 years?
Water Height
Agree with Bailey
I will be watching to see
Add new comment