July 2024 ENSO update: summer vacation
El Niño’s term is over, and La Niña is favored for the school year (79% chance for November–January). Our neutral summer break is well underway, so let’s pack our bags and hit the road.
Summer school
A quick primer for our newer visitors: El Niño and La Niña are opposite phases of the El Niño/Southern Oscillation (ENSO), a climate pattern that changes global atmospheric circulation. El Niño’s signature is warmer-than-average surface water in the eastern and central tropical Pacific, while La Niña is cooler than average. Since they can be predicted many months in advance, and change global climate patterns in known ways, we can get an idea of potential upcoming temperature, rain, drought, and other climate patterns. Neutral conditions occur when the temperature of the tropical Pacific is near average. ENSO-neutral doesn’t have a distinct impact on global climate conditions the way El Niño and La Niña do, but there’s always plenty to keep us busy here at the ENSO Blog!
Go to the beach
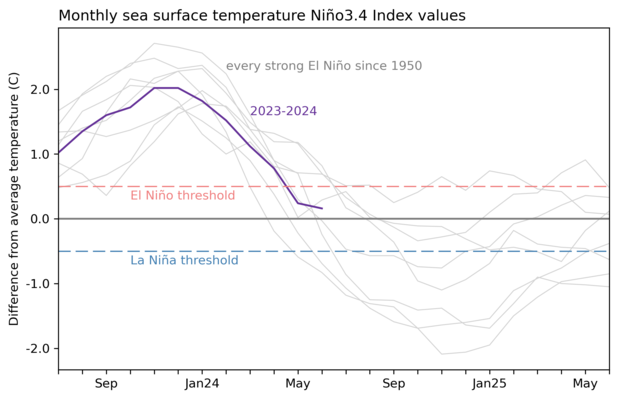
Let’s see how the tropical Pacific has chosen to spend its downtime. The sea surface temperature in the Niño-3.4 region in June was just 0.16 °C (0.3 °F) above the long-term average, according to the ERSSTv5 dataset. Niño-3.4 is our primary monitoring region for all things ENSO, “long-term” is currently defined as the average over 1991–2020, and ERSSTv5 is our most reliable sea surface temperature dataset. +0.16 °C above average is well within the ENSO-neutral range between -0.5 and +0.5 °C.
ENSO is a coupled system, meaning the atmosphere and ocean in the tropical Pacific both exhibit characteristic changes and affect each other—check out Michelle’s post for details on how the ocean-atmosphere coupling works. Currently, we find that the tropical atmosphere is also looking pretty neutral, with overall near-average cloudiness, rain, and near-surface winds.
Math camp
There’s a 70% chance that La Niña will develop during August–October, meaning a one-month Niño-3.4 index at least 0.5 °C (0.9 °F) cooler than average, an expectation it will remain there for several seasons, and atmospheric indications of a stronger-than-average Walker circulation, including more rain than average over Indonesia, drier conditions over the central tropical Pacific (near the International Date Line), and stronger trade winds.
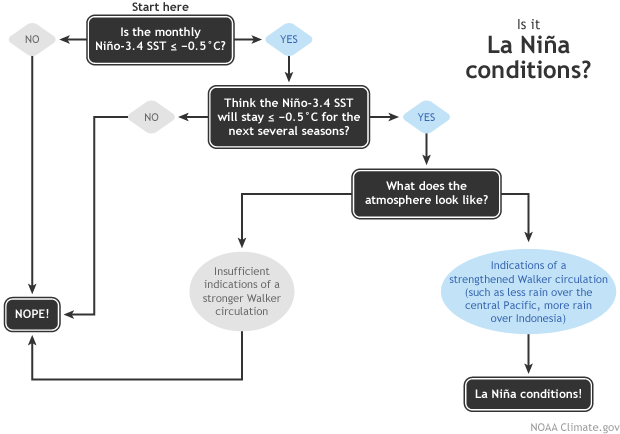
Flowchart showing decision process for determining La Niña conditions. Figure by Fiona Martin, adapted by Climate.gov.
The forecast is based on information from our computer climate models, including the North American Multi-Model Ensemble, a collection of state-of-the-art models (more info here and here). The model forecasts are in agreement that La Niña is likely, although over the past few months they have backed off somewhat on the strength of the upcoming event. Currently, the probability that La Niña will peak in our unofficial “moderate” category (3-month-average Niño-3.4 Index at least 1.0 °C cooler than average) is around 50%. The stronger the event, the more likely its expected impacts will occur over the globe.
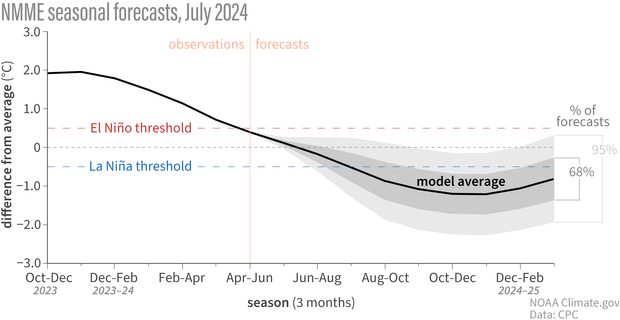
Climate model forecasts for the Niño-3.4 temperature anomalies in 2024–25. Average dynamical model data (black line) from the North American Multi-Model Ensemble (NMME): darker gray envelope shows the range of 68% of all model forecasts; lighter gray shows the range of 95% of all model forecasts. NOAA Climate.gov image from University of Miami data.
It’s not unusual for the strength predictions to change month to month, especially as we get past the spring predictability barrier, a time of year when models have a harder time making successful forecasts. We’ll have a clearer picture of the strength in upcoming months.
Also keep in mind that there’s about a 1-in-5 chance that La Niña won’t show up, and neutral conditions will last through the winter. So, while we don’t think this is a likely outcome, it’s far from impossible. If neutral lingers through the winter, we wouldn’t have La Niña’s expected shifts in global temperature, rain, and other patterns to inform our winter outlooks.
Stay home and read
One of the (many, many) interesting things about being an ENSO forecaster is that ENSO is a seasonal phenomenon, meaning it changes slowly over many months (in climate prediction lingo, any three-month period is a “season”). Our number-one metric for ENSO is the Oceanic Niño Index (ONI), the three-month-average sea surface temperature in the Niño-3.4 region; you can find the historical record of the ONI going back to 1950 here.
To qualify as an El Niño and be colored red in the historical record, we need to see the ONI stay above the El Niño threshold (+0.5 °C) for at least 5 seasons in a row. Same for La Niña, except that’s blue in our record, and the threshold is -0.5 °C. The seasonal aspect is critical, because, as I mentioned above, ENSO is a coupled system. It takes time for this relationship to develop, and more time to transmit ENSO impacts around the world.
However, we issue forecasts every month, and even monitor ENSO weekly. Weekly data can be very noisy, though, and the sea surface temperature can wiggle around. For example, the most recent weekly Niño-3.4 value was 0.3 °C above average, a slight increase from the previous couple of weeks. Does that mean El Niño is coming back? Not likely! It’s part of the random variability that we expect to see.
Also, we declare the onset of El Niño, La Niña, or neutral based on monthly averages—i.e., we don’t wait until we see a three-month-average that meets the criteria. If we did, we’d always be way behind! If we say there’s a 70% chance for La Niña to develop during August–October, we’re saying that we expect to meet our La Niña flowchart criteria sometime during that period. Way back in January, at the height of El Niño, ENSO forecasters thought there at least a 70% chance El Niño would end and neutral conditions take over in the April–June period. As it turned out, that transition occurred in May, and the April–June Oceanic Niño Index was 0.4, our first neutral “season.” We’ll take the win!
Travel the world
We monitor ENSO in the tropical Pacific, but ENSO’s impacts resonate around the globe.
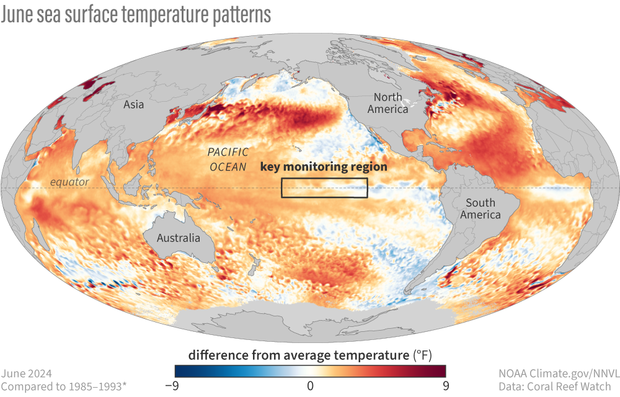
June 2024 sea surface temperature difference from the 1985-1993 average (details from Coral Reef Watch). The box indicates the location of the Niño-3.4 ENSO monitoring region in the tropical Pacific. The surface of the tropical Pacific is close to average temperature, but much of the global oceans remain warmer than average. NOAA Climate.gov image from Data Snapshots.
One of those known impacts is La Niña’s contribution to a more active Atlantic hurricane season. Also, as you can see in the above map, the Atlantic is very warm, which can feed hurricanes. Be sure to check out our recent guest post by Matt Rosencrans on NOAA’s outlook for the hurricane season. Later this month, we’ll have a guest post by University of Arizona’s Derek Lemoine on how ENSO impacts the financial markets! Enjoy your (Northern Hemisphere) summer, and I’ll see you next month!
Comments
La Nina
If la Nina does develop, seems based on the models this is going to be a borderline weak to moderate event. Seems even the most bullish models have backed away from a strong event.
La Nina stength
It does appear that a weak-to-moderate event is favored, as the latest strength forecast suggests only ~20% chance that the peak ONI will fall below -1.5C. However, I will be keeping an eye on how warm the rest of the tropics outside the eastern-central Pacific remains, especially in the western Pacific. If those regions remain anomalously warm, then the impacts of this La Nina could be stronger than we might expect if we simply judge the strength by the conventional ONI. In particular, I will monitor how the standard ONI compares with the relative ONI (RONI), which can be found here.
La Nina
Thanks Nathaniel!
Looks like the Western Pacific is really warm right now. Not sure how much they can be trusted right now but some of the SST charts I've looked at for NDJ months show the coldest waters in the Nino 3.4 and 4 regions with slightly cool to average waters in the Nino 3 and 1.2 regions
La Niña will be strong
I heard a super La Niña
La Nina Strength
You heard wrong
La Niña will be strong
La Niña be strong will be good news for Wisconsin snow drought I hope snowy and could winter
La NIna
None of the models so far are forecasting a strong event. The odds of a strong La Nina this winter are about 20% if I read that correctly.
La Nina strength
Yes, the probability of a strong La Nina (ONI less than -1.5C) is about 20%, so a strong event is unlikely (but not impossible).
Confused about seasons
I was confused about the explanation about using seasons for determining whether we're in an El Nino or a La Nina, in particular how this post indicated that one would need to continue for five seasons (or 1.25 years) to be classified as such.
So, would you explain this, please?
overlapping seasons
Sure! (I know it's a little confusing). We are considering overlapping three-month seasons at one-month intervals, like what is shown in this table. So, the total duration of five overlapping seasons would not be 1.25 years - it would be 7 months from the first month to the last month comprising the seasons (e.g., ASO, SON, OND, NDJ, DJF).
Seven
Thanks for your explanation.
Based on what you wrote, it sounds like said conditions have to last for at least seven months from start to finish for whatever is going on to be classified as an El Nino or a La Nina. As well, if they lasted less time (say, for five or six months), whatever was going on would not be considered El Nino or La Nina. Is this correct?
The 7 months is the length…
The 7 months is the length of time from the first to last months of the 5 overlapping seasons, and there may be ways to have 5 overlapping seasons meeting the criteria that don't quite hit the 7 calendar month duration, but that is at least in the ballpark of the minimum length of time that those conditions must be met. Bigger picture, yes, if conditions are not expected to persist for at least 5 overlapping seasons, then it would not be declared an ENSO event. For example, if we look back at that table, you would see that we had 4 overlapping seasons from OND 2019 through FMA 2020 for which the ONI met the minimum El Nino threshold, but we did not declare El Nino. The reasoning was that the atmosphere did not reflect El Nino conditions, and we did not expect the warmth to persist for long enough (and it didn't). Usually, the persistence and atmospheric coupling criteria go hand in hand - if the ONI duration criterion is not met, it's generally a sign that that the atmosphere and ocean are not cooperating, and we do not see El Nino or La Nina conditions reflected in the tropical atmosphere.
Okay, and thanks for your…
Okay, and thanks for your explanation. It makes more sense now.
No problem, glad I could…
No problem, glad I could help clarify things!
La Niña
Hey noaa I have a question regarding La Niña so La Niña is projected to maybe become a double dip La Niña correct cause there’s this ghost El Niño pattern that is happening and influencing Canadas weather and the United States but by august or September we should see La Niña happen by the peak hurricane season and cause more severe thunderstorms and storms and floods and MCS events correct and more precipitation in the winter and if the delay continues La Niña could last till 2028-2029 correct thanks for all your help as always
double-dipping La Ninas
Thanks for your questions, but I will start by saying NOAA's ENSO forecasters are not getting ahead of themselves - they are focused on the next several months! However, as we discussed on the ENSO Blog before, it is common for La Ninas to double-dip (and even occasionally triple-dip like we saw recently). So, if La Nina develops by late summer or fall, as expected, then both history and what we know about the physics of ENSO suggest that a double-dip La Nina (into the winter of 2025-26) would not be unusual.
IRI/CPC Plume
The latest predictions plume came out today. Looks like it is still predicting a weak event and they favor a return to ENSO Neutral by JFM. Looks different from NMME predictions plume. Maybe next month the models come into better agreement?
IRI/CPC plume
Yeah, the statistical models in particular show a considerably weaker or even non-existent event compared with the dynamical models, and some of the dynamical models are weaker than those of the NMME. We seem to have seen something similar over the past few years in which the dynamical models have been more aggressive than the statistical models, and my impression is that the dynamical models have been closer to what occurred (but I haven't seen an objective analysis to confirm this). In any case, I hope we see better agreement soon!
Why the discrepancy?
Any idea why the statistical models' predictions differ from those of the dynamical models?
Short answer: We don't know…
Short answer: We don't know. However, I can provide some insights that may be useful: 1) The biggest difference between dynamical and statistical models is that statistical models are trained on past historical data. This is generally fine, but we're also mindful that the climate is changing. 2) The "initial condition" of a statistical models is usually based on the past monthly or seasonal average of data (June or April-June 2024). Dynamical models are initialized up to the moment that they are run with the latest atmosphere-ocean conditions. In general we find higher skill for dynamical models. With that said we also consider statistical model output when making our official forecasts.
Why La Nada instead of La Nina?
So, I've heard that we are in ENSO-neutral conditions right now, rather than La Nina (which I thought I had earlier read was expected to start around this time of year). Any idea why these conditions are lasting longer than originally forecast?
Also, and on a different note, I'm pretty sure that you collect a lot of data about temperatures in the tropical Pacific (at various levels), the air above it (at various levels), barometric pressure, wind speeds, etc. And, I am pretty sure that this is too much information for any one person to handle, and that you rely on computer models to process it and give you an idea of what it means.
So, what do you do when the model gives a forecast that would probably be wrong, based on your own judgment?
You are correct. We are in…
You are correct. We are in ENSO neutral right now and the transition to La Nina is occurring slower than we first thought back in May. The main reason is that the atmosphere has not latched on helping to reinforce the colder than average water temperatures. These things happen from time to time, and could be caused by a bunch of reasons. The simplest of which might just be the chaotic nature of our atmosphere.
As for what to do if we think a model will be wrong. Well, I cannot talk for everyone else. But I assume ALL models are wrong. That doesn't mean that they aren't useful!
I try to understand how and why the models might be wrong, and how that might impact their forecast. I also use current observations to ground truth reality. While forecasting is a science, there is still an art to how scientists take imperfect model data and make a forecast. (This is also why we use probabilities when we make a forecast.)
Judgment calls with forecasts
That's a very interesting point that you assume all of the models are wrong, and that you try to figure out why and how they are wrong. As well, it sounds like deciding on what the weather for the next few days is most likely to be is something of a judgment call that relies on a combination of models and observations. And, I imagine that the more experience and education you have with it, the better your judgment is.
Is all of this correct (more or less)?
Thanks for taking the time to answer my question and to read my posts!
I think another important…
I think another important thing to remember about the models and seasonal forecasts in general is that we put them in a probabilistic format for a reason--it would be pretty much impossible to hit a specific target like "La Nina conditions will begin on August 19th, 2024," because there is so much chaotic activity in the environment. The differences between the model forecasts are a good illustration of all the various potential outcomes. However, we can provide an estimate of how likely we think certain outcomes are. For example, back in May we thought there were approximately 50-50% chances that the June–August period would meet La Nina criteria or be neutral. The probabilities are a synthesis of all those models, all of which have different predictions, plus current observations and historical outcomes.
Add new comment