July 2020 ENSO update: La Niña Watch!
ENSO is still in neutral, and likely to continue so through the summer. However, the 50-55% chance of La Niña developing in the fall and lasting through winter means NOAA has hoisted a La Niña Watch.
What’s a Watch?
I’ve been writing these blog posts for more than six years now, and the terminology La Niña Watch still makes me picture someone peering out their window, binoculars trained on the horizon, waiting for La Niña to pop up. That wouldn’t be a great use of your time, though, as a Watch means the forecast favors the development of La Niña conditions within the next six months. (Also, of course, La Niña—just like El Niño—is a seasonal ocean/atmosphere pattern that develops in the tropical Pacific Ocean, so it might be tough to see it from your window!)
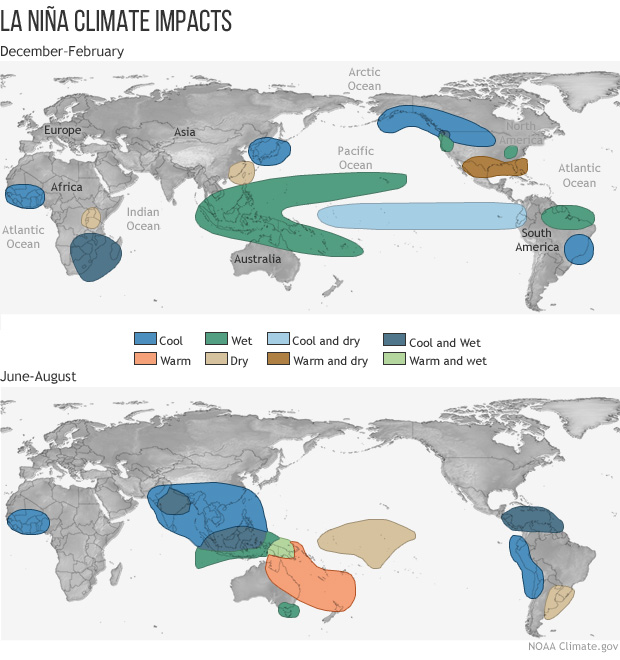
The point of a La Niña Watch is to give planners for energy, agriculture, disaster management, and other sectors a heads-up that the chance of La Niña developing is greater than the combined chance of neutral and El Niño. La Niña changes global atmospheric circulation and influences global weather and climate, so if La Niña develops, seasonal average temperature and rainfall patterns may be more predictable.
Why a Watch?
The current forecast, a 50-55% chance of La Niña, is not a very strong probability. There is still about a 40-45% chance that neutral conditions will remain through the fall and winter, and a smaller but non-zero chance of El Niño—around 5-10%.
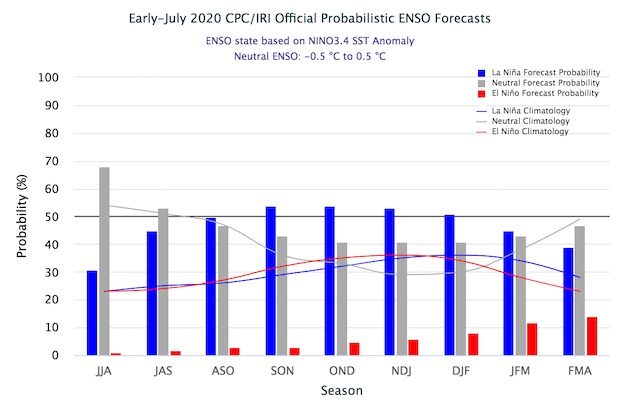
The official CPC/IRI ENSO probability forecast, based on a consensus of CPC and IRI forecasters. It is updated during the first half of the month, in association with the official CPC/IRI ENSO Diagnostic Discussion. It is based on observational and predictive information from early in the month and from the previous month. Image from IRI.
These probabilities reflect forecasters’ thinking about current conditions in the tropical Pacific and the computer model guidance. For the past few months, many of the dynamical computer models have been pointing to cooler-than-average conditions on the surface of the tropical Pacific Ocean. These models start from observed ocean and atmosphere conditions and apply physical equations to create a picture of potential future conditions. We consider many different models, and run them many times, to generate a range of potential outcomes that is as complete as possible.
Right now, most of these models predict that sea surface temperatures in the Niño3.4 region will be more than 0.5°C cooler than the long-term average—the La Niña threshold—in the fall and winter, although there is still a wide range of potential outcomes.
Climate model forecasts for the Niño3.4 Index. Dynamical model data (black line) from the North American Multi-Model Ensemble (NMME): darker gray envelope shows the range of 68% of all model forecasts; lighter gray shows the range of 95% of all model forecasts. NOAA Climate.gov image from CPC data.
We’re finally past the spring predictability barrier, a time of year when climate models are less successful at predicting how the surface temperature of the Pacific will evolve. Forecasts made in July have a good track record of predicting the Niño3.4 index in the late fall and winter, so forecasters increasingly put more weight on them.
Woo, waves
Of course, forecasters also look at the current ocean and atmosphere conditions in the tropical Pacific for signs of how ENSO will develop. Sea surface temperature anomalies (anomaly = difference from the long-term average) in the east-central Pacific, which were slightly positive through much of the winter and spring, are currently slightly negative.
Animation showing sea surface temperature departure from the long-term average from mid-April 2020 through early July 2020. Graphic by climate.gov; data from NOAA’s Environmental Visualization Lab.
The wavy pattern in the cooler-than-average region is caused by tropical instability waves, a common feature in the eastern Pacific, especially during the second half of the year. The surface water along the equator in the eastern Pacific is usually cooler than the water just to the north and south, as you can see in the temperature (not anomaly) map. This “cold tongue” is caused by cold water rising up from the deeper ocean. The tropical instability waves are the cooler equatorial surface water mixing with the warmer off-equatorial surface. You can find more about tropical instability waves in the second half of this post.
We’re watchful
One of the factors restraining the probability of La Niña in the current forecast is the lack of a substantial source of cooler-than-average water under the surface of the tropical Pacific. Subsurface temperatures are near average in the central Pacific, with some cooler-than-average water remaining in the east, as the upwelling Kelvin wave of the past couple months dissipates. The relatively conservative 50-55% chance of La Niña in part reflects this current absence of a large source of cooler water to supply the surface in the near future.
There are some indications that the trade winds in the central Pacific will strengthen over the next week or so. If this happens, it could help to cool the surface further and possibly initiate another upwelling Kelvin wave. However, this sequence of events is far from guaranteed, as winds are very difficult to forecast more than about 10 days into the future. We’ll keep our binoculars trained on the tropical Pacific, so you don’t have to!
Comments
So...
RE: So...
Global warming will continue. If La Nina occurs, it will mean a region of the Pacific ocean is temporarily cooler than average. This does affect global weather and climate, but does not slow down global warming. This post on Beyond the Data discusses how El Nino and La Nina can affect the global average temperature on a year-to-year basis.
Regular weather patterns - NO CLIMATE CHANGE
La Nina
RE: La Nina
Both El Nino and La Nina have their strongest impacts on North America's weather during the winter, but also have global impacts during the summer. Climate.gov's ENSO page has information about these impacts.
Thanks!
RE: Thanks!
As Emily emphasized in the post, the La Nina Watch means La Nina is more likely to occur than not to occur, but there is still a greater than 40% chance that La Nina will not occur. Hopefully our confidence in the forecast will increase quickly!
From Peru
Weather for winter of 2020 into 2021
RE: Weather for winter of 2020 into 2021
Hi Carol,
I understand what you're saying. As a snow lover in New Jersey, this past winter was really disappointing. Regarding snowfall for the winter of 2020-2021, it is really difficult to make any predictions at this point. However, if we do see a La Nina this upcoming winter, we may expect the odds of higher than normal snowfall to be tilted one way or the other in particular regions. Dr. Stephen Baxter wrote a great post about this found here.
RE: Weather for winter of 2020 into 2021
Climate Change
RE: Climate Change
It's true that the short observational record puts significant constraints on many climate change studies (like for changes in ENSO), but the evidence for human-caused global warming is overwhelming. The reason is that we have multiple lines of evidence, including basic theory of greenhouse gas warming, the dramatic rise of greenhouse gas concentrations due to fossil fuel burning, the instrumental record showing significant warming, paleoclimate records showing how unusual this warming is over the span of millennia, and sophisticated climate models that can only simulate the rapid warming over the past 100 years if we include the effects of increasing greenhouse gases.
Although the instrumental record is relatively short, as you mention, we still are quite confident that the observed warming is primarily caused by greenhouse gas warming rather than natural climate patterns. One of the reasons is that there are known "fingerprints" of greenhouse gas warming, including fairly homogeneous surface warming and cooling in the stratosphere, that are difficult to explain by natural cycles. In addition, many studies combining observations and sophisticated climate model experiments have attempted to attribute the observed warming to various factors, including greenhouse gases and natural cycles, and they almost always conclude that greenhouse gas warming is the dominant contribution.
I recommend the SkepticalScience website for more detailed discussions of many of the common arguments (myths) and rebuttals against human-caused global warming. Some of the most relevant for your comment are this, this, and this.
Add new comment