August 2021 ENSO update: Rockin’ out of neutral?
ENSO-neutral conditions continue in the tropics, but ENSO’s next performance may be approaching, as forecasters have increased the likelihood (~70% probability) that La Niña will reemerge by early winter. A La Niña Watch remains in effect.
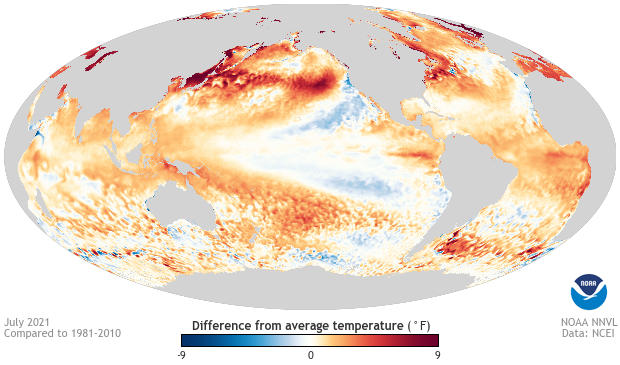
July 2021 sea surface temperature departure from the 1981-2010 average. Image from Data Snapshots on Climate.gov.
Wind of change
If you just took a very quick look at the tropical Pacific surface, you might think things haven’t changed much since last month. The July sea surface temperature in the Niño 3.4 region, the main region we use to monitor ENSO (ENSO = El Niño-Southern Oscillation, the whole El Niño and La Niña system), was 0.33°C below the 1991–2020 average. This departure from average is firmly within ENSO-neutral territory and is similar to the departure that Tom described last month.
But regular readers of the blog know that we also need to scratch beneath (and above) the surface with ENSO. When we do, we see that there have been some major changes in July. First, looking below, we see that the subsurface tropical Pacific Ocean temperatures took a sharp downward turn over the past month, breaking the string of several months of above-average tropical Pacific Ocean temperatures. If these below-average subsurface temperatures persist, then they may provide a source of cool water for the onset of the next La Niña.
Next, we look up at the atmospheric arm of ENSO, the anomalous Walker circulation, which also may be giving us some hints that La Niña is itching for a return. La Niña brings a stronger-than-average Walker circulation, meaning stronger-than-average east-to-west trade winds, higher-than-average pressure in the eastern Pacific, and lower-than-average pressure in the western Pacific. We have two indexes that measure this pressure relationship, the Southern Oscillation Index and the Equatorial Southern Oscillation Index, which are based on different locations where the pressure is recorded. Both indexes show an upward jump in July, indicating that the Walker circulation strengthened. In fact, the July Southern Oscillation Index value was the highest since last February when La Niña conditions were present.
Tomorrow never knows
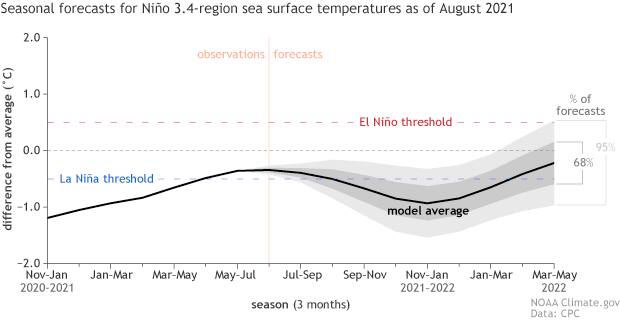
Climate model forecasts for the Niño3.4 Index. Dynamical model data (black line) from the North American Multi-Model Ensemble (NMME): darker gray envelope shows the range of 68% of all model forecasts; lighter gray shows the range of 95% of all model forecasts. NOAA Climate.gov image from University of Miami data.
So, are these recent changes just a temporary blip or a sign of ENSO’s warm-up act? The latest forecast from the North American Multi-Model Ensemble (NMME) suggest they may be more than a blip, indicating a likelihood that the surface temperatures in the Niño 3.4 region are about to dip downward. Moreover, most model forecasts predict the onset of La Niña by fall. The forecast from the NOAA Climate Prediction Center is in good agreement with these computer models, forecasting a 60-70% probability of La Niña between fall and winter of 2021/22. The likelihood of El Niño is extremely low (less than 4%) during this period, so if La Niña doesn’t develop, then it’s a good bet that we would remain ENSO-neutral. If La Niña does redevelop, it would be the second winter in a row, which is a rather common occurrence.
Have you ever seen the rain?
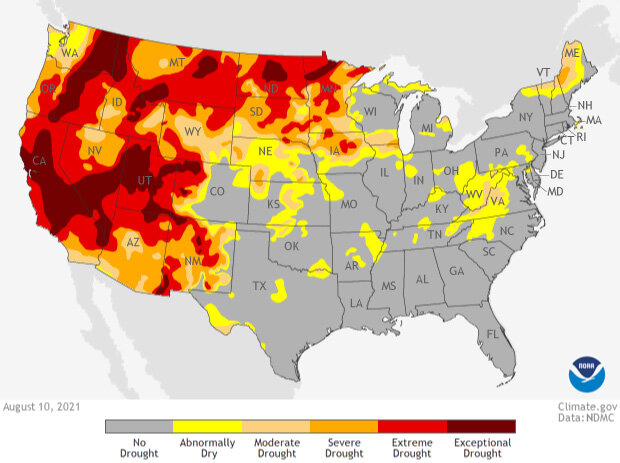
Drought conditions across the contiguous United States as of August 10, 2021, with areas that are "abnormally dry" colored yellow, and places with increasing levels of drought colored in darker shades of orange and red, with "exceptional drought" colored darkest red. NOAA Climate.gov map from Data Snapshots, based on data from the U.S. Drought Monitor project.
The possible return of La Niña is an understandable concern for our friends in the western US, who have endured terrible drought and the accompanying extreme heat and devastating wildfires. The focus of concern from an ENSO perspective is the Southwest, given that La Niña is linked to reduced rain and mountain snowfall over the region from late fall through winter.
So, what does the current ENSO forecast mean for the ongoing drought over the southwestern US? To give some perspective, I went through the archive of all NMME August ENSO forecasts from 1982 – 2020 (1) and looked at the relationship between the forecast for ENSO in November – January (the typical peak season of El Niño and La Niña) and the actual November through March precipitation over the southwestern US. The scatter plot above shows this relationship for the precipitation averaged over the southwest region extending about as far north as San Francisco, California, and as far east as Amarillo, Texas (2).
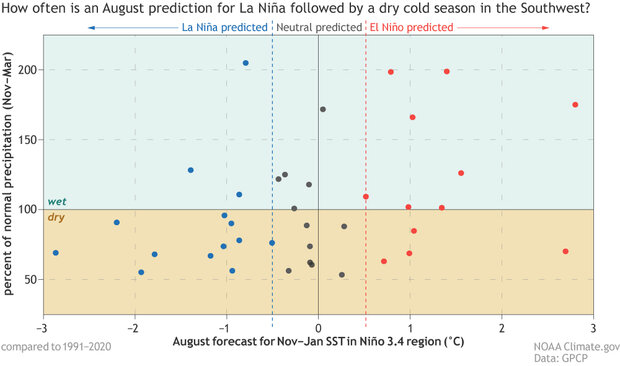
The relationship between southwestern US cold season precipitation and forecasts for early winter ENSO issued by the North American Multi-Model Ensemble (NMME) in August. The y-axis shows the percentage of accumulated cold season (November – March) precipitation relative to the 1991-2020 average. The x-axis shows the model average August forecast for the early winter (November – January) Niño 3.4 Index, with blue dots indicating forecasts of La Niña conditions (Niño 3.4 Index less than -0.5°C), black dots indicating neutral-ENSO forecasts (Niño 3.4 Index greater than -0.5°C but less than 0.5°C), and red dots indicating forecasts of El Niño conditions (Niño 3.4 Index greater than 0.5°C). The southwestern US precipitation is averaged over all land regions between 30°N and 38°N and between 102°W and 125°W. The data cover all winters from 1982-2020. Precipitation data from GPCP via ESRL PSL; image by Climate.gov.
The plot above reveals an unfortunate tendency that we may have suspected: most (11 of 14) August NMME forecasts that predicted a winter La Niña, like the current forecast, were tied to below-average precipitation in the southwestern US. However, there were a few La Niña-predicted winters near average and even a few above average, including the wettest winter during the period (3). Therefore, we can conclude that the current forecast suggests that substantial drought relief may not be likely for the Southwest this winter, but there is still a considerable amount of uncertainty at this time and no reason to give up hope!
Rock you like a hurricane
I would be remiss if I close without mentioning the potential impact of the ENSO forecast on the Atlantic hurricane season, given that we are about to enter the peak of the season. NOAA recently issued their update to the 2021 Atlantic Hurricane Season Outlook, forecasting a 65% likelihood for an above-average season, which is a slight increase in confidence since their May outlook. The development of La Niña in the latter portion of the hurricane season could help to boost the number of Atlantic tropical storms and hurricanes, so we have another reason to closely watch what happens in the Pacific over the next few months.
Closing time
I know this is the second Emily-less ENSO update post in a row, and I also feel your pain! I’m finding her shoes to be quite roomy, but I have done my best to reach the end of this post without tripping. Don’t worry, Emily will be back at the end of the month to drop some knowledge about the North American Monsoon, so please check back in a couple of weeks. In the meantime, keep your attention to the tropics – the opening act for the next La Niña may be warming up.
Footnotes
- At this point, you might be saying, “Wait, Nat, you’re telling me that the NMME existed as far back as 1982?” The answer is certainly no, but each of the NMME model centers generated retrospective forecasts as far back as 1982 (the GFDL SPEAR model forecasts only extend back to 1991, but all others go back to 1982). These retrospective forecasts are produced the same way as the current actual forecasts even though we know the answers (the actual weather that occurred) that the models should produce. Long archives of retrospective forecasts are incredibly useful for diagnosing and correcting for systematic errors in the forecasts and for providing estimates of how skillful forecast models are expected to be.
- To be more precise, I calculated the average precipitation anomaly in all land regions between 30°N and 38°N and between 102°W and 125°W. This region extends far enough north to capture the expected La Niña dry signal and far enough east to capture the region currently experiencing drought.
- This happened to be the winter of 1992/93. The NMME predicted a La Niña that did not materialize (that winter was ENSO-neutral), so this a reminder that an upcoming La Niña certainly is not set in stone!
Comments
La Nina
One miss was the NMME forecast at 8/16 which predicted a drier than normal FY16/17 window. This La Nina will not be as strong as the La Nina last year with both the CFSv2 and CPC/IRI model showing a weak La Nina. One interesting development is the CFSv2 is projecting the Nino 1.2 region to be neutral this coming winter. Will this year's La Nina be less of a traditional La Nina and more centrally based and how will that impact weather patterns?
RE: La Nina
This can be debated, but to me the most important information for impacts is not the flavor or location of the SST anomaly (unless you are living in Ecuador/Peru), but the fact it is looking more likely to be weak. Weaker events generally mean that subsequent impacts are not as confident or reliable. In other words, it's more likely that other climate phenomena and weather noise will dominate the ENSO signal b/c the forcing is weaker.
RE: RE: La Nina
Thank you Michelle for the information as always. What weather noise should we following this upcoming winter?
RE: RE: RE: La Nina
I can't speak for Michelle but I imagine she was referring to thinks like the Arctic Oscillation and similar climate oscillations that could play a role this winter. The difficult part is that forecasting those patterns far in advance is much more difficult than ENSO.
Temperatures Medieval Climatic Anomaly
Question: How do current global temperatures compare to those associated with the Medieval Climatic Anomaly? Are there any good references to this information?
The average precipitation values for the SW USA are interesting. In our region of Northern California the average annual precipitation has decline 23% since the 1870’s (close to the end of the Little Ice Age). Despite the usual ups and downs the trend line is consistent (box car averaging). According to the Jepson Manual, Second Edition, there is abundant evidence that there were two major periods of drought in California, each lasting ~ 100 years, during the Medieval Climate Anomaly. Temperatures in the Sierra Nevada Mountains were as much as 3 C above present temperatures (the starting point of “present temperatures” is not clear). During July, temperatures in our portion of the Sierra Nevada (6,600 feet elevation) averaged 5.21 F above average. So far, August is running 6.14 F above average, and for 2021 to date 2.28 F (1.2667 C) above average. Over the last 17 years, the rate of temperature increase has been greater at higher elevation than those recorded at lower elevations (my personal temperature data recorded at 1,500 feet elevation ~ 40 years).
I have many questions concerning how the ENSO, MJO, and other climatic trends influence the SW monsoon. I look forward to this posting.
RE: Temperatures Medieval Climatic Anomaly
Some of your questions may be answered in the brand new IPCC report on climate change which was released last week. Check it out:
https://www.ipcc.ch/report/ar6/wg1/
Meteorology
The site is useful for prediction of monsoon floods
General Observation
You wear the shoes just fine, good job Nat.
Sobre El Niño
Lo utilizo para las predicciones del comportamiento de la pesquería de camarón en el pacifico mexicano incluyendo el golfo de California
Add new comment