ENSO and Climate Change: What does the new IPCC report say?
Last month, the Intergovernmental Panel on Climate Change released their Working Group 1 report on the Physical Science Basis of Climate Change (1). This huge report, both in terms of importance and length (the thing is nearly 4000 pages!), covers literally everything you can possibly imagine about Earth’s climate. Past changes, current observations, future projections of warming are all in there. So what does this exhaustive summary of climate research have to say about the El Niño-Southern Oscillation (ENSO) and climate change? Let’s dig in!
How has ENSO changed in the past?
Often when discussing climate change, the conversation stays firmly placed in discussing future changes. But it’s clear that the climate is changing already. Before we can jump into what, if any, ENSO changes are expected for the future, it’s important to look back and see if ENSO is ALREADY changing. And then determine if THOSE changes are influenced by our insatiable appetite for emitting greenhouse gases (GHG). So what’s up?
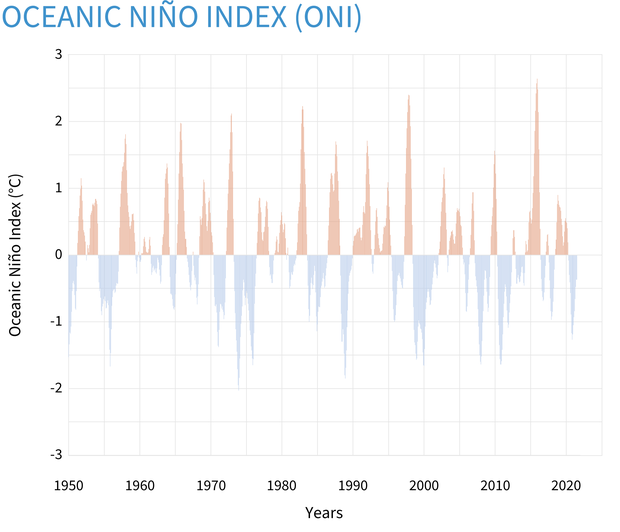
The Oceanic Niño Index, or ONI, from 1950-present. The ONI is the three-month sea surface temperature anomaly in the Niño3.4 region of the tropical Pacific Ocean. Red indicates above-average temperatures and blue indicates below-average temperatures. Climate.gov image using data from NOAA NWS Climate Prediction Center.
It’s changed!... kinda. (WITH LOTS OF NUANCE!) The amplitude (strength) of ENSO along with the frequency of high-magnitude events (aka the BIG ones) are higher since 1950 than from 1850-1950 to as far back at 1400-1950. (2) The IPCC report also noted that a higher number of El Niño events in the last 20-30 years have been associated with temperature changes that are stronger in the central Pacific rather than the east.
But those differences don’t necessarily mean that human-caused climate change is behind them (there’s that nuance!). The instrumental record and paleoclimate proxy evidence (coral, tree rings, sediment cores) all show that throughout the Holocene (the last 11,700 years), ENSO has displayed all sorts of different patterns and amplitudes. There is no clear evidence that any changes since 1950 in ENSO are all that unusual. Plus, climate model simulations that do not include rising greenhouse gases produce similarly large variations in ENSO behavior over long periods of time due solely to the chaotic nature of the climate system.
The same holds true for the trend in recent years for central Pacific El Niño events. Both paleoclimate data and climate models indicate that any changes seen are well within the range of natural variability. That’s just how the earth works sometimes.
It’s like student scores in weekly pop quizzes in high school before and after using a study aide. Before, the scores ranged from 0 to 100 with periods of consistent scores above 90 and other times of consistent 60s (or worse. Hey, it could be senior year and prom is coming up!). If you were the teacher, you wouldn’t feel confident that the student “turned a corner” from using that specific study aide until you saw a long consistent streak of higher scores. You’d seen scores like that on occasion before, after all. Maybe the flash cards work. Maybe they don’t. It’s too hard to say.
What’s going to happen to ENSO in a warming world?
First things first, it is virtually certain that ENSO will not only exist in a warming world, but that it will continue to play a huge role in affecting earth’s climate patterns (3).
But what can we say about climate change changing ENSO in the future? Especially, if we can’t say with much confidence if climate change is affecting ENSO already.
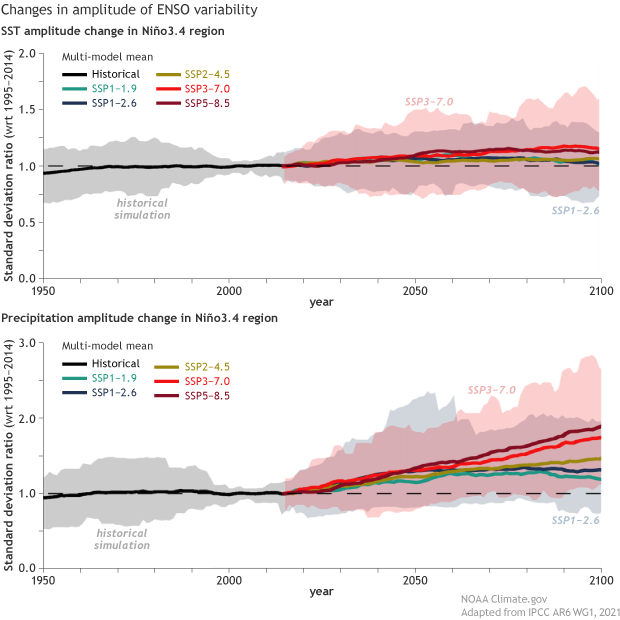
Changes in amplitude of ENSO variability of both (top) sea surface temperatures and (bottom) precipitation anomalies averaged over Niño3.4 region for 1950–2014 from CMIP6 climate model historical simulations and for 2015–2100 four shared socioeconomic pathways (SSP) scenarios. Thick lines stand for multi-model mean and shading is the 5–95% range across CMIP6 models for historical simulation (grey), SSP1-2.6 (blue) and SSP3-7.0 (pink), respectively. Climate.gov figure adapted from Figure 4.10 in IPCC AR6 WG1 Physical Science Basis report.
There is no climate model consensus on a change in ENSO-related sea surface temperature over the next century in any of the greenhouse gas emission scenarios used in the report. But regardless of any changes in ENSO sea surface temperatures, in intermediate to very high GHG scenarios, it is very likely that rainfall variability over the east-central tropical Pacific will increase significantly (4). Basically, we may expect El Niño to be wetter in this region and La Niña may be drier.
Importantly, this is NOT saying that the climate models all show no change in ENSO over the next century in these scenarios. Some of the models certainly do show change. The issue is that there is no clear consistency not just among different models, but also among different runs of the same model made with slightly different initial conditions (ensembles). Some show higher amplitude ENSO events. Others project lower amplitude events. It’s this wide range of outcomes that has led to the IPCC’s low confidence in how ENSO could change in a warming world.
Why is this all so complicated?
ENSO is a super-duper complex give and take between the ocean and the atmosphere. Changes in global surface temperatures…PSHT…that’s easy compared to ENSO.
ENSO mechanisms showing the complexity of processes involved in ENSO. Dashed contour shows the location of the strongest positive SST anomaly during El Niño (the Niño 3 region). NOAA Climate.gov, based on original provided by Eric Guilyardi.
How is it complex? Seven years ago, I described ENSO as the light in a room controlled by hundreds of dimmer switches. This is because ENSO is controlled by multiple feedbacks, which we discussed in this blog post. Climate change is like a bratty kid who goes into the room and fiddles with each switch, turning some up and others down. Whether the end result is a brighter room (stronger or more frequent ENSO) or a darker room (weaker or less frequent ENSO) is hard to predict.
Even without climate change affecting things, modeling ENSO is hard! With so many influences, it’s easy for a climate model to get the “right” answer (the light in the room) for the “wrong” reasons (adjusting different dimmer switches to get the final “correct” amount of light). Climate models can show a wide range of potential ENSO outcomes for the future by slightly changing a whole bunch of “dimmer switches.” It’s hard to say which switches are more “right” than the others.
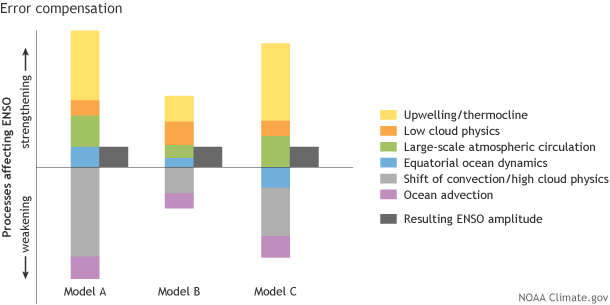
A generalized look at how general circulation models can predict different impacts on ENSO from various mechanisms or processes related to ENSO, yet still predict the same resulting ENSO amplitude. Occasionally, models can even predict a different sign for a mechanism (see equatorial ocean dynamics in blue for model C), and still have the resulting ENSO amplitude be the same. It is therefore important to verify that models correctly predict the final ENSO amplitude as well as the correct ENSO mechanisms, or processes. Graphic by Fiona Martin, based on work by Eric Guilyardi.
And of course, the last complicating thing is just how different ENSO has been over the long-term past. With such a variable history, it makes it more difficult to see a climate change specific signal pop out.
Any new research shed any light on ENSO and Climate Change?
Yes, and no. Yes in a sense that new research is seemingly released monthly. And no in a sense that the new research is still often at odds. One week an article might suggest that ENSO events will get stronger in a warming world. And the next week a paper comes out and says “Nuh uh, it’ll be weaker”.
If anything, this just gives more credence to the conclusions of the IPCC report of low confidence in how ENSO, overall, will change. That’s not to say that it won’t. We just don’t know yet exactly how things will play out.
Any last IPCC WG1 Physical Science Basis report thoughts?
There is no actual new science done in this report. Instead, the scientists who authored this report were tasked with assessing the state of the science to come to conclusions about what can be said about climate change and its impact on everything. It should be expected that some individual scientists might feel that their research wasn’t given enough credence. But the authors’ goal is to reflect the research in totality. Believe me, there will be plenty more research into how ENSO might change due to climate change, so stay tuned!
Footnotes
(1) The report is the first of three reports to be released as part of the sixth assessment report from the Intergovernmental Panel on Climate Change. The next two reports to be released in the first half of 2022 will be on adaptation and mitigation of climate change.
(2) How can scientists reconstruct the state of ENSO back to the 1400s? Through the use of climate proxies like fossil coral. We’ve covered this topic a couple of times on the ENSO Blog. First in a guest post by Dr. Kim Cobb and second in a post by me on volcanos.
(3) The exact phrasing found in the IPCC AR6 WG1 report is that “it is virtually certain that the El Niño–Southern Oscillation (ENSO) will remain the dominant mode of interannual variability in a warmer world.”
(4) The reason for this is that the average sea surface temperatures are expected to warm more in the eastern and central tropical Pacific relative to the rest of the tropics, which makes it easier for an ENSO sea surface temperature anomaly to induce a rainfall anomaly even if the ENSO sea surface temperature anomalies do not change.
Comments
Climate.gov
This is a geat series. It puts complexity into readily understandable articles which are not too short and not to long. The graphics are great. I have purloined many of them although I am no longer teaching. Climate (and population) have everything to do with all history (and prehistory). We are soon on our way to do more work on understanding the ridged gardens many North Central Native Americans used for centuries. My wife and I believe all the work that went into them was to create good soil for growing maize where there was little to no good soil tp be found in the area. The climate at the western edge of the Upper Peninsula MI is between lakes Superior and Michigan so it is possible to grow a good crop in that you have good soil and a moderated climate. The work of moving tons of soil made it possible to take advantage of the moderating effects of the lakes.
Paleo-anthropology
I love paleo-anthropology! At any given time, I have a least a half dozen ideas for different departments or blogs for Climate.gov, and on my short list would be a blog devoted to paleoclimate-anthropology. It would cover things like you mentioned--how ancient people adapted to their climate and landscape--as well as climate changes that proved to be beyond their ability to adapt, and which therefore led to collapse.
More a question than a comment
https://twitter.com/NOAAClimate/status/1442851597315313667?s=20 says
“Well, there is no climate model consensus on a change in ENSO-related sea surface temperature over the next century in any of the scenarios.” Is this a statement about mean state? Or just variability, amplitude in particular?
RE: more a question than a comment
Good question. This is a statement on the variability (standard deviation) in Nino-3.4 SST, which is shown in Figure 2 above. The IPCC section 4.5.3.2 says:
"There is no consensus on changes in amplitude of ENSO SST variability across CMIP iterations."
and
"While CMIP6 models show no robust change in ENSO SST amplitude in the mid- and long-term period across all four SSPs, a robust increase in ENSO rainfall amplitude is found particularly in SSP2-4.5, SSP3- 7.0, and SSP5-8.5"
Also, in Section 4.4.3.2:
"... detection of robust near-term changes of ENSO SST variability in response to anthropogenic forcing is difficult to achieve due to pronounced unforced low-frequency modulations of ENSO."
and
"Analysis of CMIP6 models shows a slight increasing trend in amplitude of rainfall variability over Niño3.4 region in the near term attributable to mean moisture increase, regardless of changes in ENSO SST."
Submitted by tom.diliberto…
Submitted by tom.diliberto on
To add onto what Michelle said and to touch on the mean state.
Section 4.5.3.2
"There is no consensus on changes in amplitude of ENSO SST variability across CMIP iterations. The main factors driving the diversity of ENSO SST amplitude change in climate models are internal variability, SST mean warming pattern, and model systematic biases."
"The response of the tropical Pacific mean state to anthropogenic forcing is characterized by a faster warming on the equator compared to the off-equatorial region, a faster warming of the eastern equatorial Pacific compared to the central tropical Pacific (e.g., El Niño-like mean SST warming, see Chapter 7, Section 40 7.4.4.2), and a weakening of the Walker circulation in most models. Those models with a El Niño-like warming tend to project a strengthening of ENSO SST variability whereas models with a La Niña-like warming tend to project a weakening of variability"
It's important to note that first statement. That the changes in amplitude of ENSO SST variability are driven by multiple factors.
https://www.ipcc.ch/report/ar6/wg1/downloads/report/IPCC_AR6_WGI_Chapter...
In other words, who knows?
In other words, who knows?
Sorta
From a perspective of confidence on what will happen, yes sorta.
Of course there are scientists in either camp who think based on their research that there is a signal.
Only one thing is for sure, there will be a lot more research on this topic
Legal side
I have a question about how legally protected the climate of our planet is. That is, are there restrictions on all types of pollution. And in the US, are we guided only by our law...or are there still world agreements?
[This comment has been edited to remove a link. --RL]
Good Post
Very informative post and the article is very well written. Thank you for the guide.
Comments have been disabled on this article