Beyond the Data Blog
Let’s face it: El Niño is the life of the party. He’s the Most Interesting Child in the World. The good folks over at The ENSO Blog have filled up a whole blog, and still there are enough leftovers for Beyond the Data, where we don’t always blog about teleconnections, but when we do, we prefer El Niño.
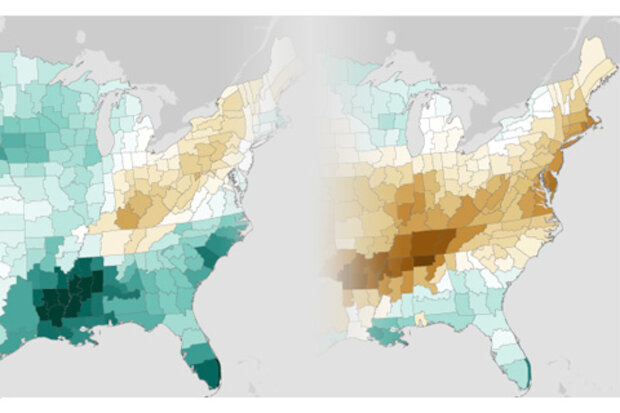
We’ve already written about how El Niño will push the needle toward 2015 being the warmest year on record. But thinking a little more directly about the state of the climate in the U.S., how might a strong El Niño impact things here? Will it put a dent in the Western U.S. drought, one of the defining climate events of the decade? What about the rest of the country?
If you’ve been followi…
Read article
Anthony Arguez1, Scott Applequist1, Michael C. Kruk2, Michael F. Squires1, and Russell S. Vose1
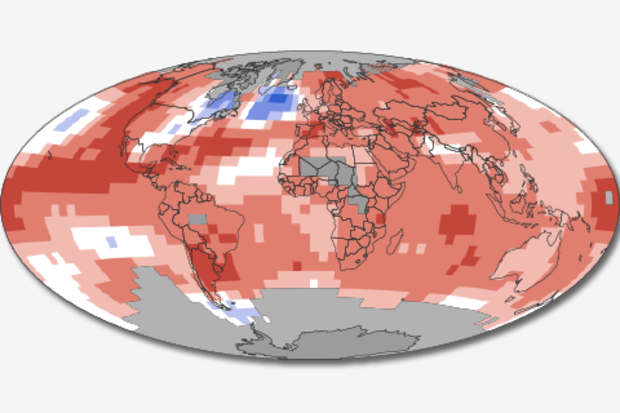
Global surface temperatures have remained at or near record-warm levels throughout 2015, leading many to prognosticate that 2015 will eclipse 2014 as the warmest year on record1-3, perhaps by a relatively large margin.
Based on the latest data from NOAA’s global surface temperature dataset (NOAAGlobalTemp), the 2015 global temperature average through July is running 0.09°C (0.16°F) above the 2014 average and 0.13°C above the January-July 2014 average. That might not seem like a lot, but 2014 eclipsed 2010 as the warmest year on record by an even smaller margin, 0.04°C.
The strong …
Read article
The State of the Climate is a rather huge report―in the neighborhood of 270 pages―that updates the status of major climate variables and recaps regional climate conditions around the world every year. The report just celebrated its silver anniversary: 25 years of annual publications. The first report was written by 29 scientists from 3 countries: the United States, the United Kingdom, and the former Soviet Union. Impressively, six of those scientists just celebrated their 25th anniversary of working on this report. This year, more than 400 authors and editors from 58 countries joined those original six to help bring together the State of the Climate in 2014.
We release each year’s rep…
Read article
In the monitoring branch, our temperature analyses garner a lot of attention. We are asked big questions such as: What was the warmest year on record? How fast are global temperatures changing? These are important questions that we work to answer, but our regional-scale data and services also have immense benefits.
Someone smarter than me once said, “No one ever died under a global temperature time series.” This is a great way to say that we can report on global average temperatures all we want, but it is the local impacts of change and variability that matter for the average person. At the National Centers for Environmental Information (NCEI), we work tirelessly to translate our treasure…
Read article
Two weeks ago, I wrote about 2015’s chances of dethroning 2014 as the warmest year on record and how the maturing El Niño increases those odds.
This week, going Beyond the Data, we’ll unpack what that first-place ranking really means. In the big picture, the actual rank of an individual year isn’t that important. In fact, using ranks can really over-emphasize their importance. So why do we use them?
The Power of Context
Let’s start with something light, like some [really amateur] comparative psychology. As animals, we use real-time information to identify threats. This keeps us (and bears) from walking into fires. As humans, we seek patterns. It’s what we do. We thrive…
Read article


