December El Niño update: phenomenal cosmic powers!
If you’ve been following the development of this El Niño, you may have heard in the media that sea surface temperatures in the central equatorial Pacific are at near-record highs. Are we seeing the most powerful El Niño ever?
Remember: ENSO is not all about the ocean
El Niño is one phase of the El Niño-Southern Oscillation (ENSO). An ENSO event involves changes in both the sea surface temperatures and in the overlying atmosphere across the tropical Pacific. In the case of El Niño, sea surface temperatures are warmer than average, and the Walker Circulation, which operates like a vertical loop through the tropical Pacific atmosphere—is weakened. This weakness shows up as more clouds and rain in the central and/or eastern Pacific and less over Indonesia, weaker near-surface winds (the trade winds, that usually blow from the east to the west), and weaker upper-level winds.
The whole system is important, because there are feedbacks between the ocean and the atmosphere that help to strengthen El Niño. For example, weaker near-surface winds let the surface waters warm in the central and eastern Pacific. The warmer waters lead to more convection (rising warm air), which changes the circulation and further weakens the near-surface winds… and so on! (Check out Tom’s post on the Walker Circulation for more details about the system.)
Another thing to remember about ENSO is that meaningful changes take place on seasonal timescales (the average over several months). The important effects of El Niño on the U.S. and other regions are related to its average strength over the fall and winter, not how strong it is on any particular day or week. We do monitor the weekly and monthly changes in the sea surface temperature and the atmosphere to get a hint at where things are headed, but we’ll ultimately judge the strength of this El Niño by its average over the seasons.
Yeah, yeah – what about this one??
Right out of the gate, let’s talk about that November sea surface temperature in the Niño3.4 region. The ERSSTv4 data set shows that this November was 2.35°C warmer than the November average—tied with November 1997’s 2.33°C. (Yes, I know those numbers aren’t identical, but they’re within the statistical margin of error, which means as far as rankings are concerned, they’re tied.), This dataset has been carefully maintained to ensure that it is historically consistent, so it’s the best, most reliable one to use to compare 2015 to 1997 (or any other year.)
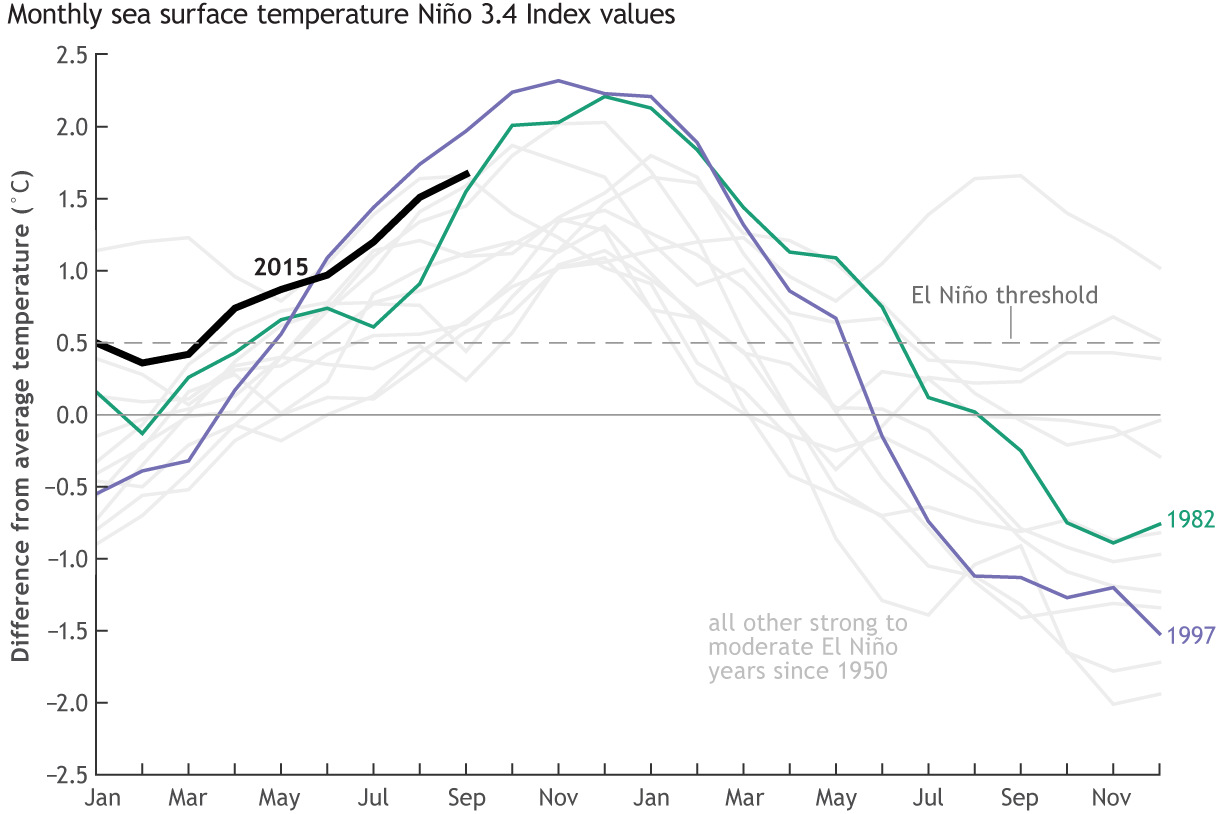
Monthly sea surface temperature in the Niño 3.4 region of the tropical Pacific compared to the long-term average for all moderate-to-strong El Niño years since 1950, showing how 2015 (black line) compares to other strong events. Climate.gov graph based on ERSSTv4 temperature data.
The Niño3.4 ERSSTv4 for September–November is 2.04°C, second to 1997’s 2.18°C. Since we’re looking at this El Niño very likely placing in the top three (with 1997-98 and 1982-83), let’s compare some of the other components of the system right now. I’m going to focus on 1997-98, since by most assessments that’s the strongest El Niño in our short, 1950-present record.
The atmosphere hasn’t been responding to the high ocean surface temperatures in the tropical Pacific in quite the same way as it did in 1997. For this next bit, remember that weaker winds = stronger El Niño response. In a side-by-side comparison of the near-surface winds during May-November 2015 and 1997, you can see that the anomalies (the departures from average) were larger during 1997 than 2015.
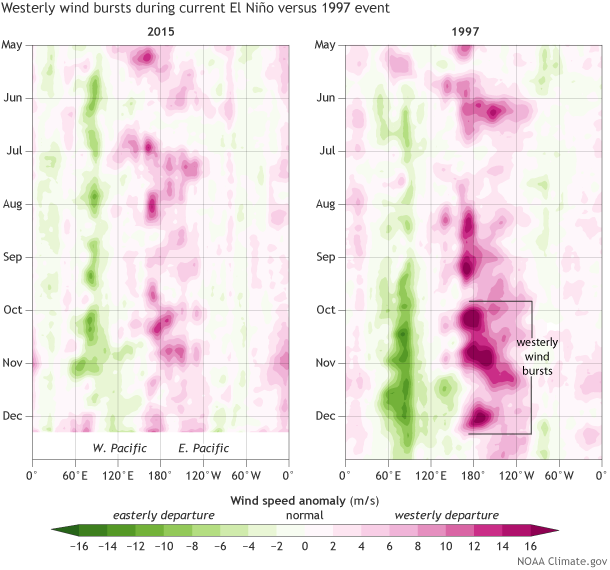
Near-surface wind anomalies over the tropical Pacific (5°N-5°S) in 2015 (left) compared to 1997 (right) in the months leading up to the winter peak of each event, starting at the top in May and ending in November (2015) and December (1997) at the bottom. Each row in this type of image is the departure from average (1981-2010) at that time. Westerly wind bursts (dark pink areas) were much stronger in fall 1997 than they have been this year. NOAA Climate.gov image, based on data provided by the Climate Prediction Center.
Wind anomalies can get a little confusing, because during an El Niño the normal easterly (blowing from east to west) winds weaken, and if they weaken enough, they turn around and blow from the west. This happened during October of 1997, when you can see the large anomaly.
If you average the September – November low-level winds over the central Pacific, you get about 8 miles per hour, trailing 1982 (1.5 mph) and 1997 (-2.5 mph) pretty substantially (positive numbers means the wind is blowing from east to west, and negative means west to east). The average wind speed of the trade winds this time of year is about 16 miles per hour.
Another measurement of the atmospheric response to El Niño’s warmer waters is the Equatorial Southern Oscillation: November 2015 is currently third, behind 1997 and 1982. While we’ve seen consistently more clouds than normal over the tropical Pacific this year (evidence of increased convection due to the warm water), this response has also been less than it was in 1997 over the central to eastern Pacific.
There is a lot we don’t understand about how El Niño works, and exactly why the atmospheric response is weaker in 2015 than it was in 1997, despite very similar east-central Pacific temperatures, is going to be a hot research topic going forward.
A look under the surface
The surface of the equatorial Pacific is where warmer-than-average ocean waters interact with the atmosphere. Those surface temperatures are driven by a large amount of warmer water under the surface: without a big source of warmth, short-term fluctuations would dominate and we wouldn’t have an El Niño. (Check out Michelle’s post on Kelvin waves for details on how this works.)
We monitor the ocean heat content in the upper 300 meters (about 1000 feet) of the equatorial Pacific. 2015 has had a large, consistently above-average ocean heat content since this El Niño began in March, as you can see below. However, a side-by-side comparison with 1997 reveals there is still not as much heat fueling this El Niño as there was eighteen years ago.
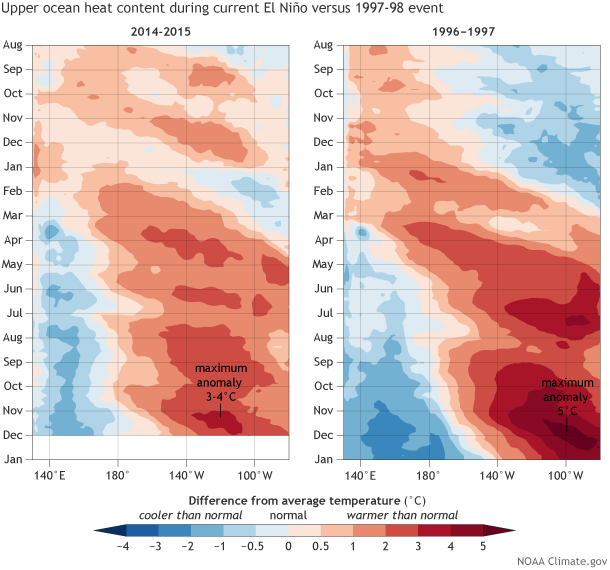
Heat content in the upper few hundred meters of the tropical Pacific (5°N-5°S) before and during the current El Niño event (left, August 2014-November 2015, top to bottom) and the 1997-98 event (right, August 1996-December 1997). Each row in this type of image is the departure from average (1981-2010) at that time. The maximum heat content anomalies during the peak of the 1997-98 event were as much as 5°C (darkest red), whereas this year, they are 3-4°C, and they cover a much smaller area. NOAA Climate.gov image, based on data provided by the Climate Prediction Center.
What does it all mean?
Every El Niño event is different, and even if there are some strong similarities between this El Niño and another, we’d be really surprised if everything lined up exactly the same. By most measures, this is one of the top three strongest El Niños since 1950, and there’s still a chance it could record the highest Oceanic Niño Index (the three-month-mean sea surface temperature anomaly in the Niño3.4 region, our primary ENSO metric). But ocean temperatures are just one way to measure ENSO, which can be tracked in many ways.
While the warmer-than-average ocean waters are likely reaching their peak about now, they will remain a huge source of warmth for the next several months to drive the main impacts on temperature and rain/snow over North America, which typically follow the peak. The main impacts season is December–March, so we’re just at the very beginning of finding out what this El Niño event will bring to the U.S. There’s no doubt that El Niño 2015-2016, which has already shown its power around the world, will have a significant effect on the U.S. winter.
Comments
RE: Is the blob really gone? And is the RRR still there?
The above average SSTs off the West Coast have been much reduced over the last couple of months. "The Blob," in my opinion, was never really well defined (which exact region?) so it is dificult for me to comment on it. An enhanced, zonally elongated Pacific jet stream is helping to cool down SSTs, but I agree that it is shifted farther north than is typical during El Nino. So instead of southern CA obtaining more precipitation, it is the Pacific Northwest that has been targeted. There are probably multiple factors driving this shift--- I'm inclined to think the more positive Arctic Oscillation (AO) has been a prime factor in this shift.
However, we are now seeing changes in the circulation over the Pacific, so we expect more classical El Nino-like impacts to become more prominent.
The Blob
El Nino
What a great thread!
Add new comment