A polar vortex double header
“It could be … it might be … it…!” Wait, is it? A homerun for the stratosphere? After a brief respite, the stratospheric polar vortex is expected to weaken again with potentially another major sudden stratospheric warming forecast to occur in the next week. But didn’t we just have a sudden stratospheric warming event?? Read on to find out what’s in the stratosphere’s line-up and how this double header fits in with typical stratosphere behavior.
Loading the atmospheric bases
The atmospheric players have been positioning themselves again for another polar vortex disruption. First up, the current stratospheric conditions are primed for tropospheric wave activity because the polar vortex has been stable and even a bit on the strong side since the end of January. Those strong, but not too strong, west-to-east winds are ideal for atmospheric planetary waves to slide from the troposphere into the stratosphere. This is well-timed as the tropospheric weather patterns, particularly low pressure over the North Pacific and the high pressure over the North Atlantic/Europe, are in a good position to hit amplified wave activity into the stratosphere. Finally, while the stratospheric polar vortex has been strong and stable, it’s likely to start weakening soon as wave activity within the stratosphere itself increases.
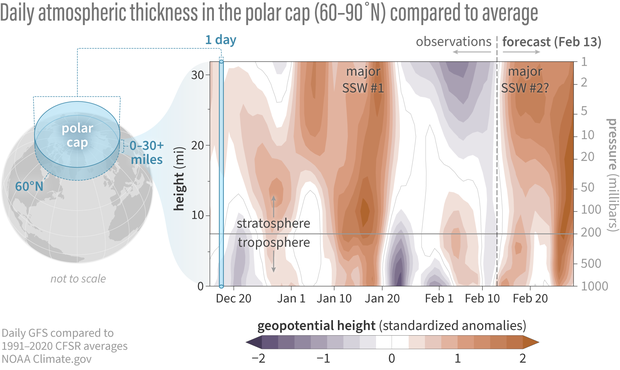
Differences from average atmospheric thickness (standardized geopotential height anomalies) in the column of air over the Arctic from the troposphere to the stratosphere since early December 2023. Since the beginning of February, the troposphere seems to have been uncoupled from the simultaneous conditions directly above in the stratosphere: lower-than-average thickness in the high stratosphere (purple), higher-than-average thickness near the surface (orange). But the recent positive thickness anomalies may be linked to what happened in the stratosphere in mid January. Based on the Global Forecast System (GFS) model, the stratosphere and troposphere are forecast to team up again in the next few days, as the positive height anomalies (orange areas) extend throughout the atmosphere. NOAA Climate.gov image, adapted from original by Laura Ciasto.
Home run or foul ball?
Is the combination of wave activity from both the troposphere and the stratosphere enough to knock the polar vortex out of the park off the pole and weaken the winds? The majority of the forecast models say yes, the winds at 60 degrees North* (the mean location of the polar vortex) will briefly reverse direction within the next week or so, commencing the second major sudden stratospheric warming in as many months. If this second event does occur, it will not be a replay of last month’s game. That major warming event was unique because the disruption started in the lower stratosphere and tore up the vortex from below. This stratospheric warming looks to be more typical, with the wave breaking disrupting the middle stratosphere.
It’s too soon to tell if the disruption will run the bases in the usual way, working its way down to the troposphere. Current forecasts suggest the stratosphere and troposphere will be coupled into the end of February, but the models have been fluctuating from day to day on the degree of coupling, so uncertainty is high. On average, stratosphere-troposphere coupling can occur up to 6 weeks after the warming event, and it can be intermittent because the troposphere has its own processes and weather patterns beyond stratospheric influences. Furthermore, the major warming event may only last a few days, but the polar vortex is forecast to remain weak into March, which can increase the odds of impacting the weather over the next several weeks.
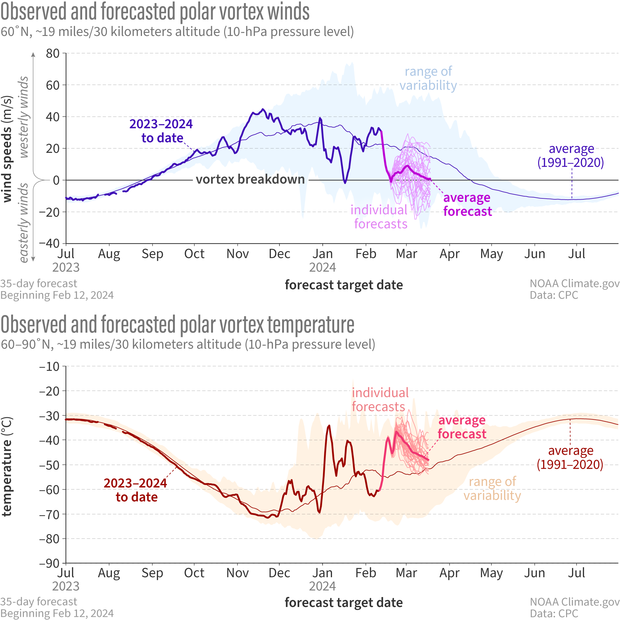
Observed and forecasted (NOAA GEFSv12) wind speed (top) and temperature (bottom) in the polar vortex compared to the natural range of variability (faint shading). For the GEFSv12 forecast issued on February 12, ~90% of the individual model runs predict a reversal of the vortex winds (top, thin magenta lines), accompanied by a sharp increase in stratospheric temperature (thick pink line). While the average of the individual forecasts just crosses the 0 m/s threshold, other forecast models are indicating a larger wind reversal (not shown). If a major warming does occur, it’s currently forecast to last no more than a few days, but the vortex could still remain weaker than normal for the next few weeks. NOAA Climate.gov image, adapted from original by Laura Ciasto.
Batting averages and other stratospheric statistics
If we were summarize the entire observational record since the 1950s [footnote #1], we’d say major sudden stratospheric warming events typically occur every other year or so. Some years have no major warmings. When they do occur, they’re most common in January or February. What’s less common is having them in both January and February or, for that matter, twice in any winter season.
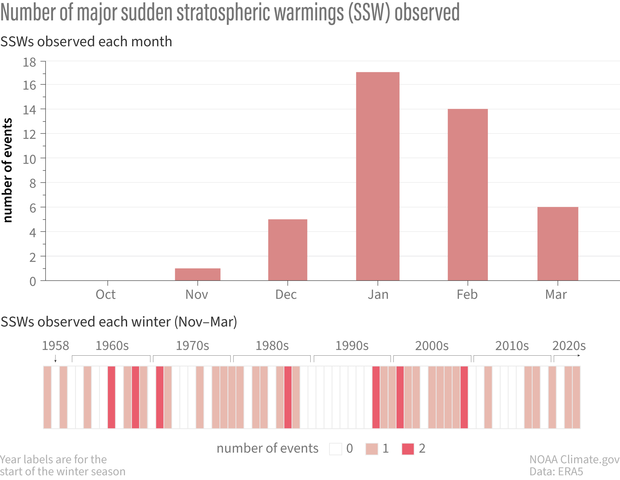
Frequency of major sudden stratospheric warming events as of a function of (top) winter month and (bottom) winter season (November-March) since 1958. On average, there have been roughly 6 major events per decade since 1958. Some decades have had more than 6 while others have had less. Major sudden stratospheric warmings are most common in January and February. Only one major event has occurred in November. Statistics are based on ERA5 Reanalysis. NOAA Climate.gov image, adapted from original by Laura Ciasto.
Actually, there have been a handful of winter seasons with two major sudden stratospheric warming events [footnote #2]. However in most previous cases, the double major warmings are separated by at least two months whereas this event would only be separated by one month. This may be because the SSW in Jan this year only very briefly reversed the stratospheric winds allowing the polar vortex to recover very quickly.
Almost post game analysis
The season isn’t over yet, but it’s hard not to wonder why this winter has been so active. (Although we’re all pretty sure it was the launch of this blog. We know that you know we’re watching, stratosphere.) It will likely be a good subject for future research. However, there are indications that other climate patterns that influence the polar stratosphere may have been poised to help the stratosphere knock this year out of the park. In a future post, we’ll talk about how these signals, particularly those in the tropics, might impact the stratospheric home runs statistics.
[*Editor's note. Revised on April 26, 2024. This sentence originally said ,"...the polar vortex winds will briefly reverse direction...".] It's been revised to prevent confusion between the polar vortex as the average atmospheric flow of the polar stratosphere and as a specific manifestation of that circulation on a given day. For more context, read We're going to stop saying "polar vortex reversal".]
Footnotes
- It is likely that sudden stratospheric warming events occurred before the 1950s, but observational records of the stratosphere are sparse before then.
- These numbers only include sudden stratospheric warmings that occur in the middle of the winter (referred to as mid-winter warmings). We’ll discuss it more in a future post, but a final warming event occurs every spring as the polar vortex breaks down for the season. Those events are considered separate.
Comments
Commonalities
Interesting post.
It looks like having two sudden stratospheric warming events in a winter is kind of rare (about once every 10 years or so, on average). So, questions:
* What did other years with two SSWs have in common? That is, were there some atmospheric factors that happened during most or all of them that did not happen when there were not two?
* Does this year have any of those in common with those?
Thanks for reading this, and I look forward to hearing from you.
Common features of double SSWs
Great question. I have not looked specifically at the commonalities in terms of the atmospheric conditions themselves. It'd be a great topic of research, though the sample size might be too small so it'd be hard to draw conclusions. Usually though, double warming events occur 2-3 months apart so there's time for the stratosphere to rebound. During 4 of the previous 6 double events, the first warming occurred in December.
If this event unfolds as forecast, it'll only between a month between events, which is interesting because it usually takes longer for the stratosphere to recover. However, the event last month was not typical because it started in the lower stratosphere so that might be a factor.
Triple SSW
I was looking at the three to four week forecast yesterday, and I saw (in the discussion) that it was calling for a third SSW in early March, though it indicated that the previous two had been fairly weak. So, I had some questions:
* As far as anyone knows, has this ever happened before?
* How strong were the previous two SSW events this winter?
* Assuming it happens, what would its causes be?
Thank you for reading this, and I look forward to hearing from you.
Yes, the forecasts are…
Yes, the forecasts are indicating that the west-to-east winds are about to reverse direction in the next week or so (near March 4 based on the most recent forecasts). If it occurs at this time, it likely won't be considered a third SSW. While the wind reversal in mid-January was short-lived and weak, most datasets observed it. However, for the mid-February event, not all datasets met the SSW criteria that the wind reversal is observed in the daily mean.
Regardless of the dataset, this next reversal will still be the 2nd of the season for the following reasons:
1) For the datasets that didn't observe a wind reversal in mid-February, this next event will be considered the second SSW.
2) For the datasets that did observe a wind reversal in mid-February, this next one is occurring within 20 days of the previous one (Feb 19 and ~Mar 4) so it will all be considered one event.
Because the datasets don't all agree that winds reversed in mid-February, this means that the start date of the warming could vary February and March depending on dataset.
Based on the current forecasts, this wind reversal looks to be larger and longer-lived than the previous one(s). We have another post coming out on Friday that will have more information on what's driving this latest disruption.
Measurements
From what you wrote, it sounds like if two SPV wind reversals happen within a couple of weeks of each other, they're both considered to be part of the same SSW (assuming, of course, that all the datasets agreed that both happened). Is that correct?
I look forward to reading the next blog post in this series, when it comes out. Thanks for your educational outreach work!
Yes that's correct. Two…
Yes that's correct. Two potential scenarios (assuming the SSW happens in March):
1) the winds on Feb 19 didn't reverse direction, but did in March, then the second major SSW onset is whatever day in March that it occurs.
2) the winds did reverse direction Feb 19 and then again in March. If less than 20 days passed between the reversals (which is likely), then the second SSW onset is Feb 19.
New post coming out shortly!
Your blog
Excellent work. Educational and entertaining. Looking forward to your next post
Thanks!
Glad you find it helpful!
Polar vortex
Has anyone identified discrete triggers in the troposphere for SSW’s? For example, say a sub 950 North Pacific cyclone or 2060 East Siberian high. In other words, could there be discrete teleconnections near the boundary layer that might give us a heads up on these epic events?
SSW precursors
Yes, there are several patterns that tend to occur in the troposphere prior to an SSW. These are explained in detail in a previous post: https://www.climate.gov/news-features/blogs/polar-vortex/cooking-strato….
For a more specific case, the 2021 SSW was preceded by a persistent low pressure weather system over the North Pacific and high pressure weather system over the North Atlantic and Eurasia. There was also a bomb cyclogenesis over the North Pacific that may have further reinforced that pattern, giving an extra nudge to the stratosphere (https://www.climate.gov/news-features/blogs/enso/sudden-stratospheric-w…).
We haven't talked about it yet, but the Arctic Oscillation, which represents the see-saw of pressure between the pole and the mid-latitudes (https://www.cpc.ncep.noaa.gov/products/precip/CWlink/daily_ao_index/ao…), can also influence the stratospheric variability. We'll talk more about it in a future post.
Weather
Where are all the coastal snow storms that were supposed to occur in thus El Nino winter. Totally blown forecsst.
ENSO impacts
There is a another blog that focus on ENSO-related impacts that might be more helpful. This post might be relevant: https://www.climate.gov/news-features/blogs/snow-pain-snow-gain-how-doe…
Predictive models?
Is there enough data to build a predictive model on the likelihood of various types of atmospheric dynamics events? Has anyone built such a model?
Predictive Models
Because sudden stratospheric warmings typically happen every other year or so, the observational is record is limited. Dynamical models are key for predicting the likelihood of these events. But there are precursors that could be used to build predictive models. In addition to the tropospheric weather patterns mentioned in a previous post (https://www.climate.gov/news-features/blogs/polar-vortex/cooking-strato…), we also look at eddy heat fluxes in the stratosphere and troposphere to show how much wave activity is occurring and where it is coming form.
Great post and blog
I always really enjoy your posts, and this blog has quickly become my go-to resource when explaining SSWs to my friends and family -- your explanations are clear and easy to follow, and I appreciate how you weave fun metaphors and analogies throughout!
Thanks!
Glad you enjoy the posts!
Add new comment