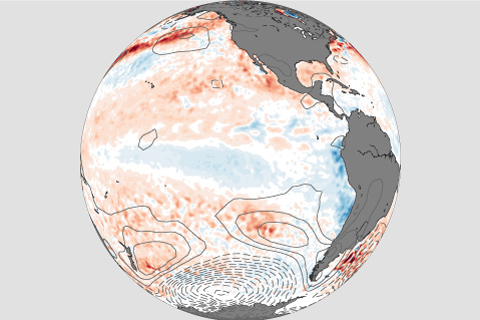
Wondering how strong any potential El Niño might be this winter? Maybe you should look to the South Pacific for clues.
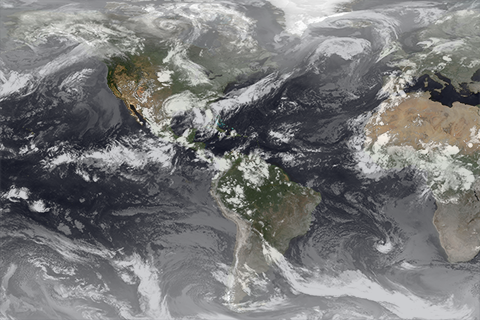
Want to forecast both weather and climate? First this means understanding the faster and slower moving features of our atmosphere, ocean, and land.
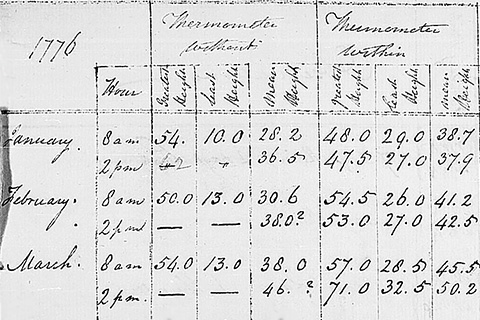
The U.S. climate record begins 125 years ago. Where do the data come from, and who had the foresight to begin collecting and preserving observations so many years ago?
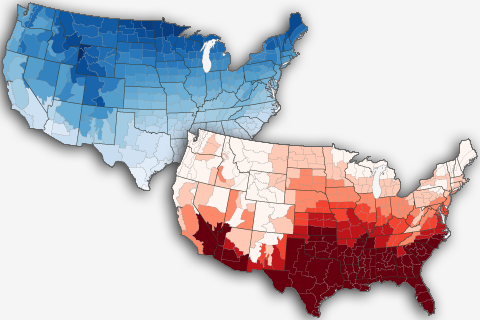
Average temperature maps can wash out days or weeks of hot and cold extremes that are important for things like energy planning and crop risk assessment. Jake Crouch explains how degree-day maps can bring back the details.
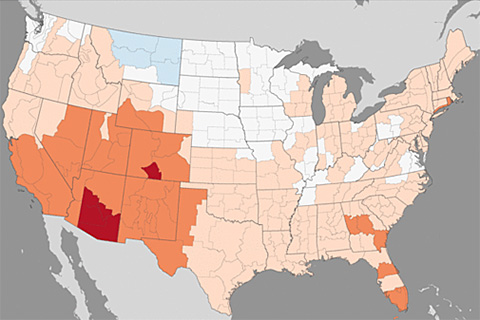
A quick spin around the March 2018 U.S. climate scene, all else being equal.
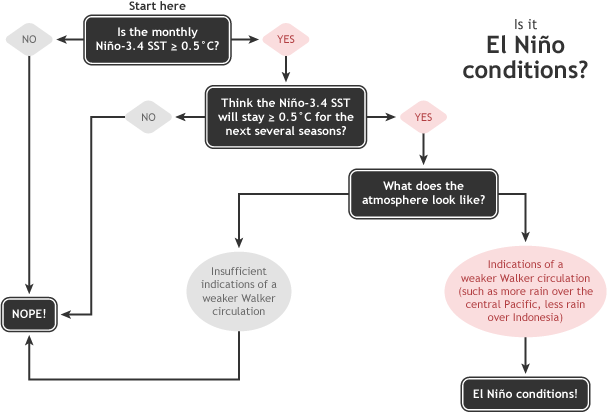
Find your favorites: an index page of links to ENSO blog posts.
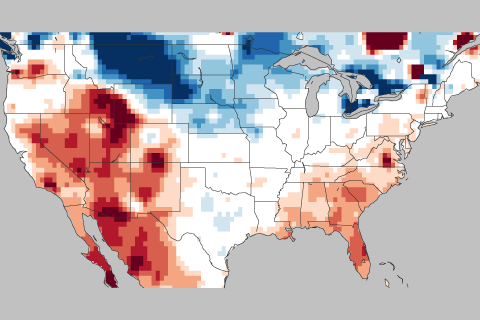
In this week's ENSO blog, Tom DiLiberto gets all judgy over the 2017-2018 Winter Outlook—using science of course.
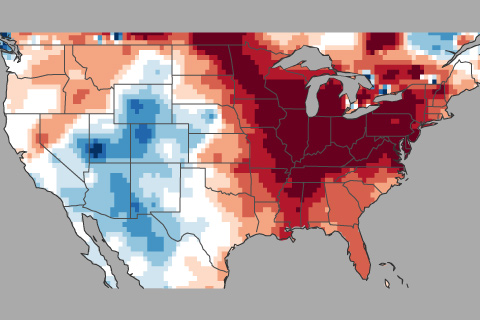
How this winter's temperature swings may have been partially driven by the Madden Julian Oscillation or MJO.
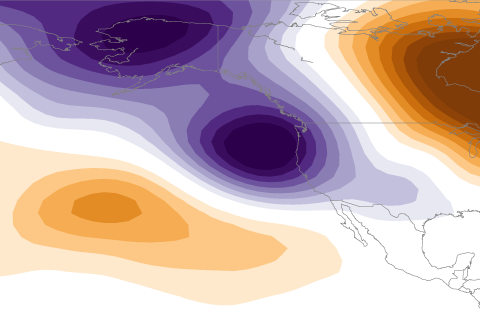
La Niña usually means a drier than average water year for California. So what happened in 2016-2017 when a weak La Niña coincided with a remarkably wet water year?
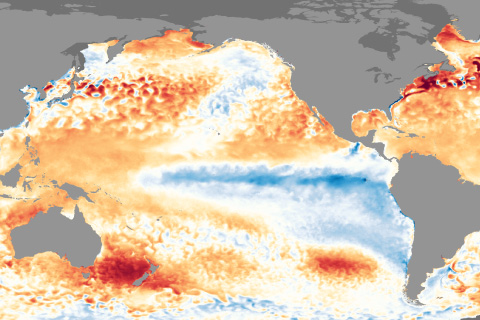
La Nina conditions appear to have peaked in strength and will likely last through the upcoming winter.